In February, California's community college board approved three new bachelor's degree programs over CSU's objections: cyberdefense, physical therapy, and transborder environmental design. Two of those had been stuck in limbo since 2023. Illinois and Iowa are considering similar legislation. The community college baccalaureate is one of the fastest-moving policy questions in higher education right now.
Into that debate landed a January 2026 NBER working paper (Acton et al., w34684), billed as the "first comprehensive, national study" of CCB graduate earnings. Their headline: CCB graduates earn about $2,000 less per year than traditional BA holders, making the CCB an "intermediate credential," better than an associate degree but unable to close the gap with a real bachelor's.
That's exactly the kind of finding that gives ammunition to opponents of CCB expansion. So it's worth looking carefully at what the data can actually support.
I replicated the paper's methodology and extended the analysis. The deeper I looked, the less the headline held up. The problems stack up in layers, from simple to fundamental.
Layer 1: The CCB coverage is terrible
The paper uses the Census Bureau's Post-Secondary Employment Outcomes (PSEO) data, which covers 13 of the 24 states that authorize CCB degrees. That's a reasonable starting point. But coverage and usable data are different things.
PSEO suppresses earnings cells when cohort sizes are too small to protect privacy. Because CCB programs are newer and smaller than traditional BA programs, they get hit hardest. Here's what the suppression does to the sample:
- 108 CCB programs identified in the PSEO data
- 54 (50%) have unsuppressed earnings at Year 1
- 30 (29%) have unsuppressed earnings at Year 5
- 18 (17%) have unsuppressed earnings at Year 10
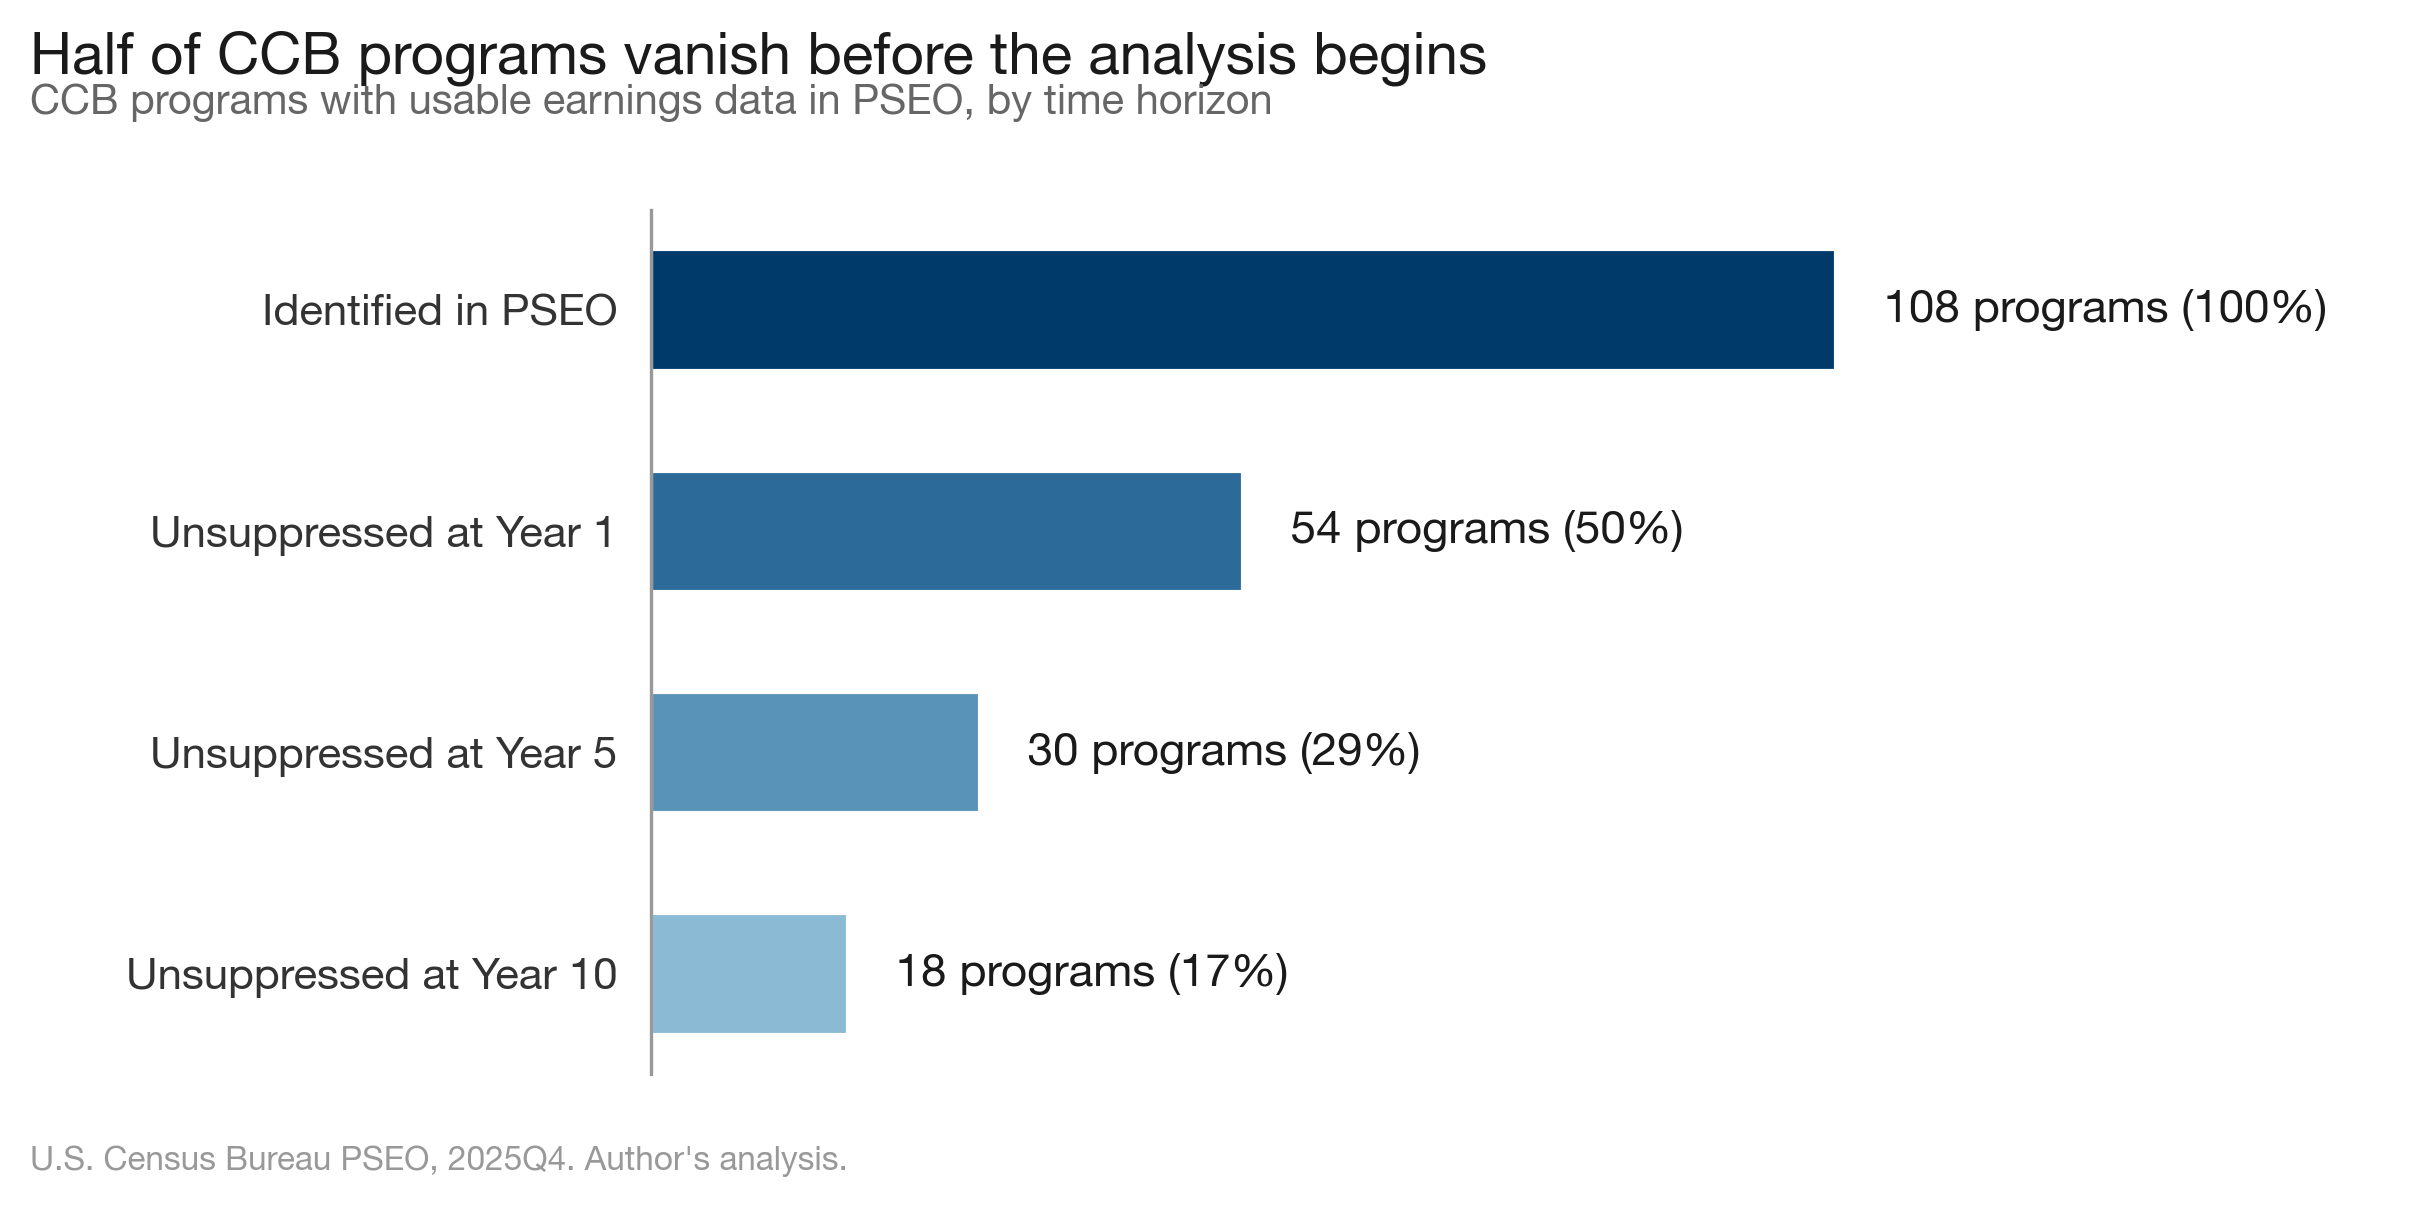
Half the CCB programs the authors can identify have no usable earnings data at all. And the suppression isn't random; it hits fields unevenly. At Year 1, the paper's biggest regression-adjusted penalty is in Computer Science (-$30,000), which rests on 6 CCB institutions. Engineering Technology, another large penalty: 6 institutions. Agriculture, where the paper also finds a significant penalty: 2 institutions. Two. The paper found a statistically significant national earnings penalty for CCB agriculture graduates based on two schools.
For traditional BA programs, the coverage picture is fine. Hundreds of large public universities with big graduating classes rarely hit the suppression threshold. So the comparison is structurally lopsided: a well-covered BA side versus a heavily censored CCB side where entire fields rest on a handful of schools.
The paper does not discuss how this asymmetric suppression shapes its findings. It's not a minor caveat. It's a selection filter baked into every number they report.
Layer 2: Utah is 70% of the data
My replication reveals a concentration problem the paper does not report: Utah institutions account for 73% of CCB earnings observations at Year 1.
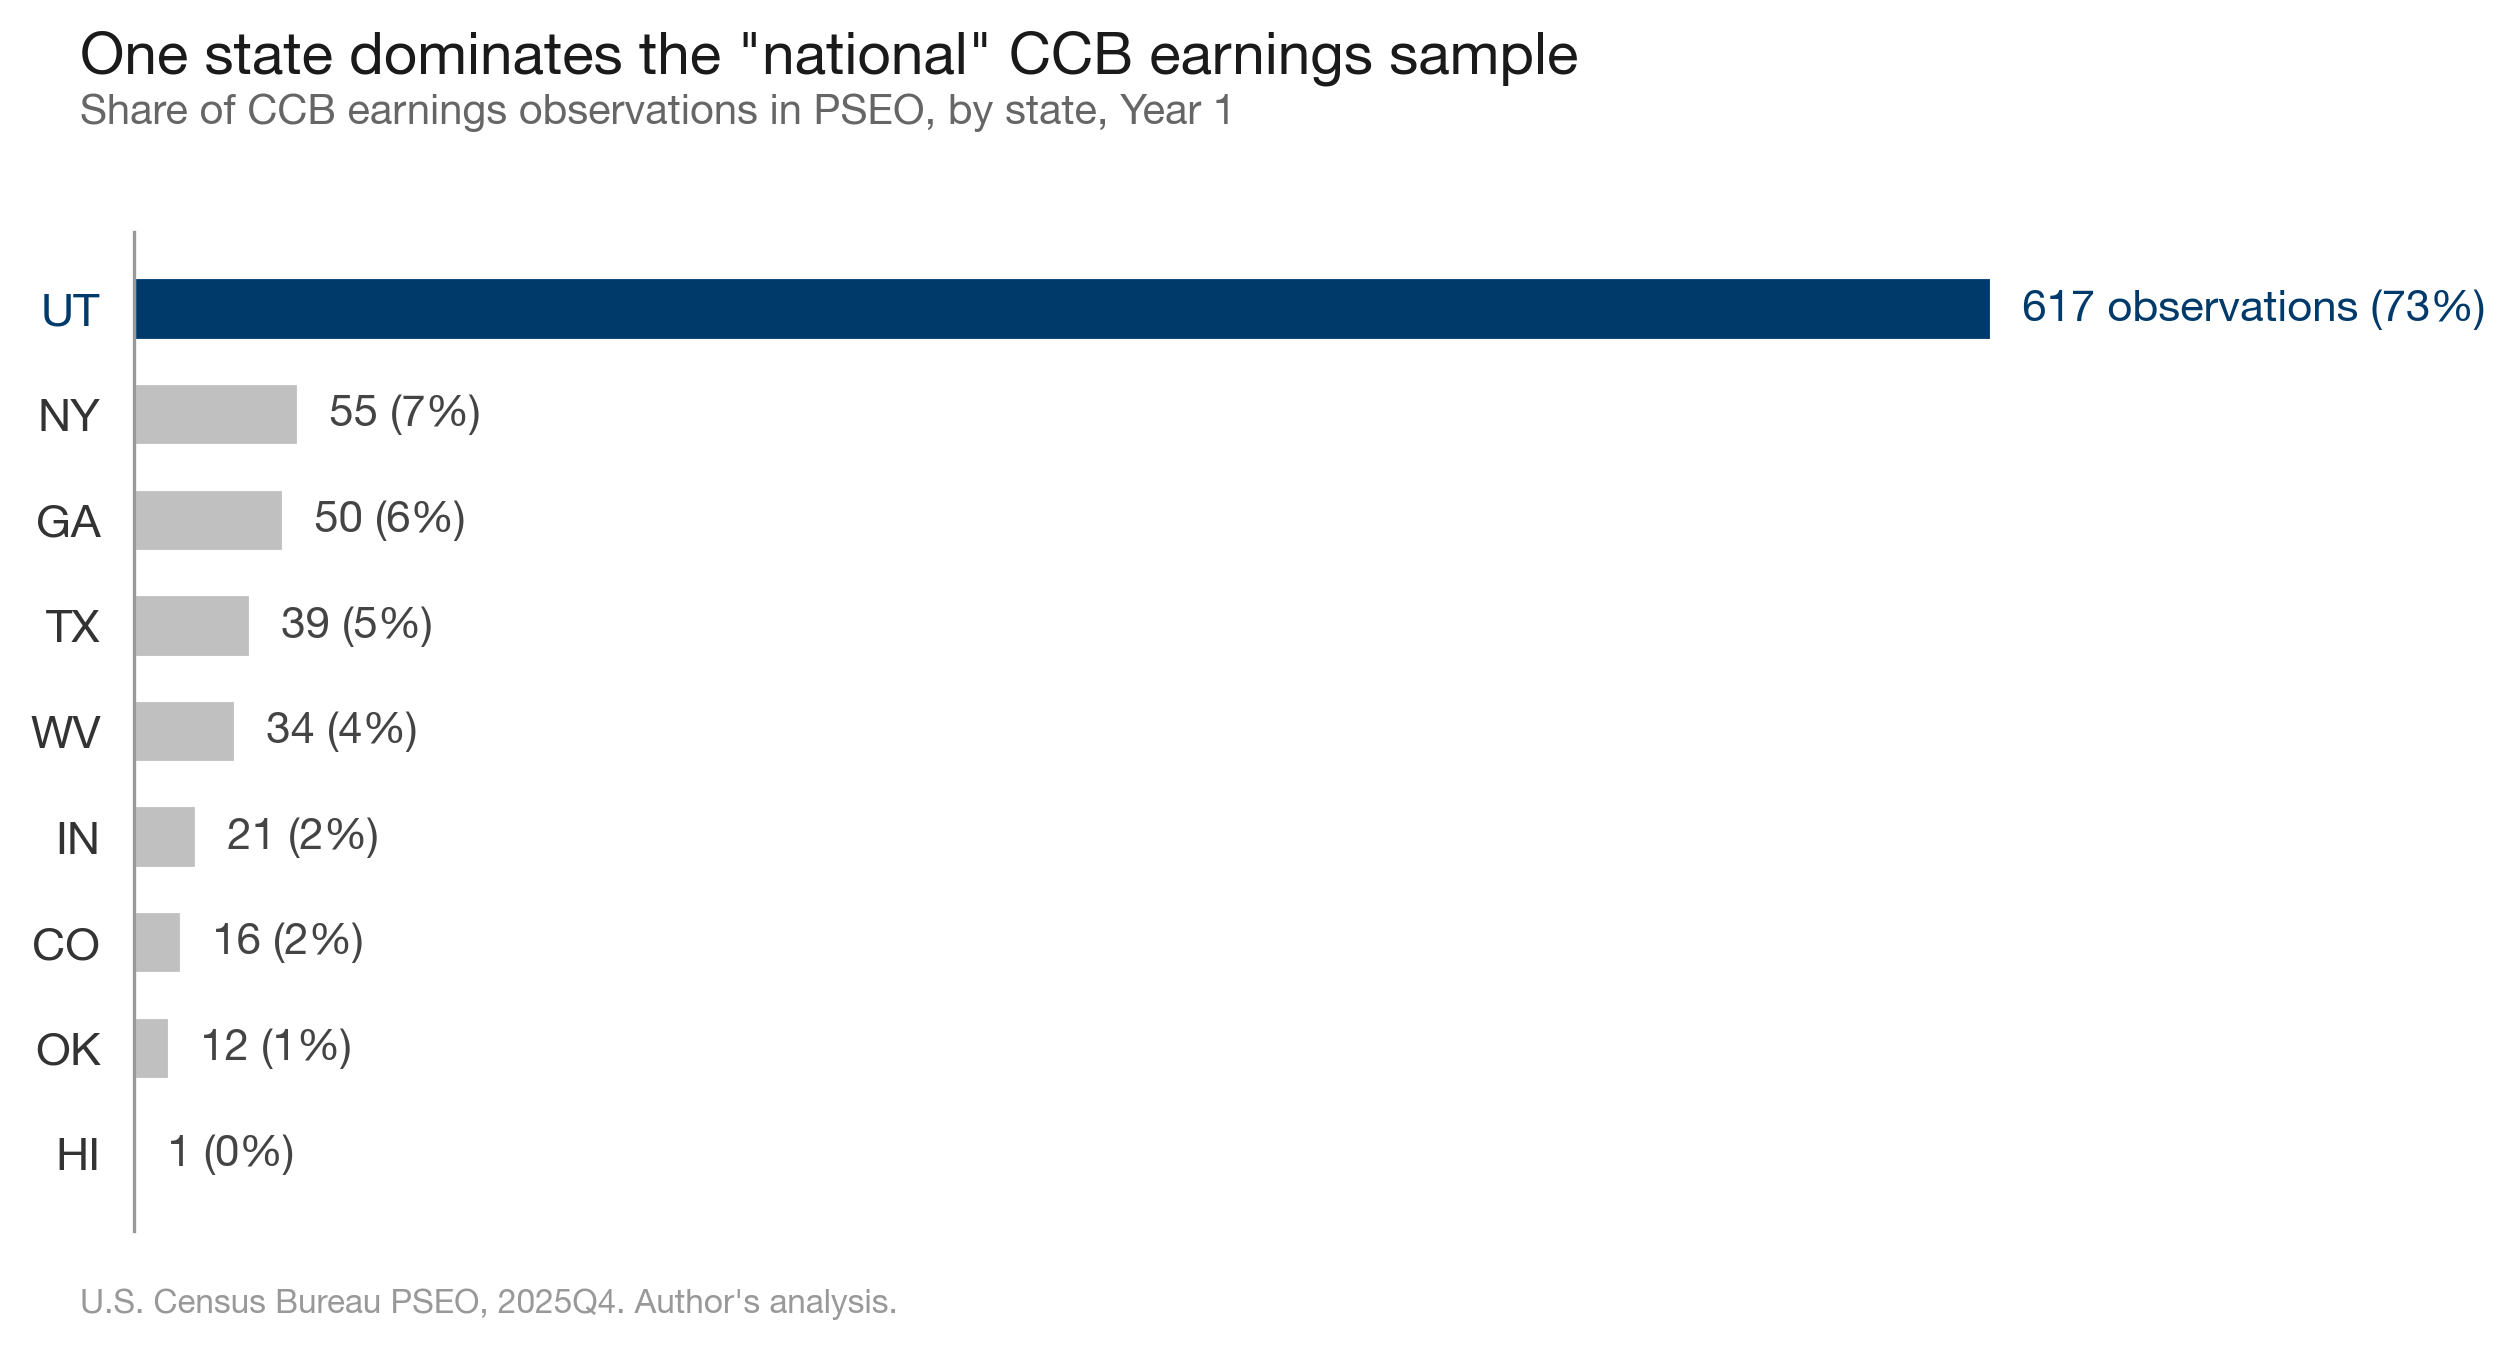
Five Utah schools (Utah Valley University, Weber State, Utah Tech, Southern Utah, Snow College) dominate the CCB sample at every time horizon. Utah was one of the earliest CCB adopters and has the completer volume to avoid suppression. That's why it shows up. But it means the "national" findings are, in practice, mostly Utah findings.
This matters because Utah's CCB landscape is distinctive. Several of these institutions have offered bachelor's degrees for decades. Utah Valley University enrolls over 40,000 students. Weber State has Division I athletics.
Calling this a "national study" is a stretch. It's a study of what PSEO can see, filtered through suppression rules that systematically exclude the programs policymakers care most about.
Layer 3: Year 1 earnings are unstable
The PSEO data reports earnings at Year 1, Year 5, and Year 10. The paper uses only Year 1, citing the "emerging nature of CCB programs." That's understandable given the suppression problem described above. But it means the paper's central conclusion, that CCB graduates face an earnings penalty, is drawn from the narrowest possible window into graduates' careers.
This isn't just a limitation. It's out of step with how the field actually evaluates program quality. The College Scorecard reports earnings at Years 4, 6, 8, and 10. Gainful employment regulations measure debt-to-earnings ratios using median earnings at the 3-year mark. State workforce longitudinal data systems typically benchmark at 3-5 years. Even the new Workforce Pell program, which expands federal aid to shorter career-focused training, uses a 3-year earnings window, with the explicit understanding that what matters is a trajectory, not a snapshot.
There's a reason everyone else measures further out. At Year 1, earnings across credential levels are surprisingly compressed. Certificates, associate degrees, and bachelor's degrees often produce similar initial earnings because Year 1 reflects job placement speed and local entry wages, not the long-run value of a credential. The differentiation happens over time as career ladders diverge. That's the whole point of measuring at 3, 5, or 10 years: to capture the trajectory that actually matters for students making enrollment decisions.
A one-year snapshot can't distinguish between a credential that delivers less value and one whose value takes longer to appear. Building a policy conclusion on Year 1 earnings alone is uncommon practice for a reason.
Layer 4: Missing controls that are readily available
The paper's comparison is structurally unbalanced: a handful of CCB institutions measured against hundreds of traditional BA programs ranging from open-access regionals to R1 flagships. That imbalance is baked into PSEO. But it's also something you can partially address with controls that are freely available in IPEDS, and the paper doesn't use them.
No institutional stratification. The traditional BA comparison group pools every public four-year university in a state together. In Georgia, that puts Georgia Tech graduates and Fort Valley State graduates in the same bucket. In Texas, it puts UT Austin and Sul Ross State on the same side of the comparison.
The paper uses state-by-CIP fixed effects, which compare within state and field but do not control for selectivity within a state. IPEDS provides admissions rates, test score distributions, Carnegie classifications, and enrollment size, all of which could stratify the traditional BA group into something resembling a fair comparison. A CCB graduate in Texas is being benchmarked against the weighted average of UT Austin, Texas A&M, UH, and a dozen regional schools. Restricting the comparison to non-flagship regionals, schools that actually serve similar student populations, would be straightforward with IPEDS data.
The students who enroll in CCB programs are, by the paper's own motivation, students unlikely to attend flagship universities. Comparing their outcomes to flagship graduates and labeling the difference a "penalty" treats a difference in who attends as a difference in what the degree delivers.
The paper acknowledges its analysis is "descriptive" and "does not fully account for selection into CCB degrees." But as a statistician, I find the disconnect between the caveats and the framing hard to square. You can't call your analysis descriptive in the limitations section and then build the entire paper around language like "earnings penalty" and "intermediate credential." Those are causal frames. A penalty implies the degree caused lower earnings. An intermediate credential implies a ranking. The data as presented: uncontrolled for selectivity, measured at a single unstable time horizon, drawn from a geographically concentrated and heavily suppressed sample, doesn't support either claim. It supports: "after controlling for state, field, and cohort, but not institutional selectivity, we observed a difference at Year 1." The choice to frame that difference as a penalty is an editorial decision, not a statistical one.
Layer 5: The longer-horizon data already existed
This is the part that's hard to explain away. The PSEO data the authors used reports earnings at three time horizons: Year 1, Year 5, and Year 10. The paper acknowledges this but builds its entire conclusion, "intermediate credential" and "$2,000 penalty," on Year 1 alone. The longer-horizon data was there all along.
The authors cite the "emerging nature of CCB programs" and limited longer-run data as justification. And it's true that the sample thins at longer horizons (29% of programs at Y5, 17% at Y10). But thinner data is not no data. Thirty programs at Year 5 is a smaller sample than 54 at Year 1, but it's not too small to report. Especially when the Year 5 results tell a materially different story.
I ran the Year 5 and Year 10 numbers. They were sitting in the same dataset.
What the longer horizon shows
The results challenge the "intermediate credential" narrative.
| Field | Year 1 | Year 5 | Year 10 |
|---|---|---|---|
| Business | +$3,192 | +$7,557 | +$11,328 |
| Nursing and Healthcare | +$3,607 | +$5,147 | +$12,437 |
| Criminal Justice | +$3,239 | +$2,766 | +$7,442 |
| Liberal Arts | +$367 | +$1,806 | +$6,088 |
| Computer Science | +$2,510 | +$8,686 | +$1,168 |
| Education | +$392 | +$400 | +$258 |
| Engineering Technology | -$3,886 | -$8,335 | -$30,305 |
In six of seven fields with Year 10 data, CCB graduates earn as much as or more than traditional BA graduates. Computer Science, which previously appeared negative, now shows a small positive gap.
It's worth pausing on this: even at Year 1, the unconditional medians from the same dataset show CCB graduates ahead in most fields. The "$2,000 penalty" only appears after applying the paper's particular regression controls, which don't account for institutional selectivity. It is an artifact of a specific regression specification applied at the most unstable time horizon.
The one clear exception is Engineering Technology, where the gap widens to -$30,000 by Year 10. But that's 6 CCB institutions (schools like Vincennes University and WVU-Parkersburg) compared against a traditional BA pool that includes UT Austin, UIUC, and Georgia Tech.
I want to be upfront about my own limits. I report unconditional medians, not regression-adjusted estimates. The CCB sample at Year 10 is small (13 institutions, 7 states). Different time horizons reflect different cohorts, not the same people tracked over time. These numbers are not the basis for sweeping claims. I'm not making one. My point is that the data doesn't support sweeping claims in either direction, and the paper's framing oversteps what the evidence can carry.
But they are the basis for questioning a causal-sounding headline built on even thinner data.
The policy question
The real question for policymakers isn't whether CCB graduates out-earn UT Austin grads. The question is whether CCB programs deliver comparable long-run value to regional four-year universities, at lower cost, with better geographic access, for students who might not complete a bachelor's degree otherwise.
You can't answer that question nationally with a dataset that suppresses half the programs you're studying, draws 73% of its usable data from one state, compares community college students to flagship university graduates, and looks only at Year 1 earnings. You might be able to answer it for Utah, but the paper doesn't frame it that way. As more states adopt and expand CCB programs, the data will catch up. When it does, we'll be in a much better position to see what these degrees actually deliver. Until then, the honest answer is that we don't know yet.
The PSEO data is a valuable resource. But producing a "national" study of an emerging credential type from a dataset with these coverage and suppression characteristics requires more caution than the paper's framing suggests.
We should stop making policy pronouncements about community college bachelor's programs based on PSEO sampling artifacts.
The longer-horizon data we do have suggests the story is more optimistic than the headline. But the most important takeaway might be simpler than any earnings table: the data isn't there yet, and acting like it is does more harm than the $2,000 gap ever could.
Data: U.S. Census Bureau PSEO, 2025Q4 release. Institution classification via IPEDS HD2023. All figures show unweighted medians across institution-CIP-cohort observations in constant 2023 dollars. Interactive charts and replication code at opportunitydata.org/ccb_comparison.