Earnings & Mobility · Analysis
Which Short-Term Credentials Climb, and Which Stay Flat
Workforce Pell's accountability test asks whether completers clear an earnings level at a point in time. It never asks whether earnings grow. Ten-year graduate trajectories across twelve certificate fields show the difference, and it is large.
Opportunity Data · June 2026
Workforce Pell took effect July 1, 2026 (Public Law 119-21; final rule, Federal Register, May 19, 2026). Its accountability mechanics screen programs on completion and on a value-added earnings test: completers' median earnings, less 150 percent of the federal poverty line, must exceed the program's tuition and fees. Whatever its other merits, that is a level test. It checks where graduates' earnings sit at one point in time, and it is silent on where they go afterward.
Levels and slopes are different facts about a credential, and public data measures both. Census PSEO follows actual certificate completers for a decade after they finish, with earnings adjusted to constant 2023 dollars using the CPI-U, so differences over time are real growth. Across twelve certificate fields commonly cited as Workforce Pell targets, real ten-year growth ranges from about 25 percent to more than 70 percent: the steepest fields deliver roughly three times the climb of the flattest. Most of these fields would clear the federal earnings test comfortably. The test cannot tell them apart.
The difference is not whether credentials "stack." Some of the flattest fields stack on paper, and some of the steepest never stack at all. What separates them is whether the credential attaches to a wage escalator: stacked credentials that carry raises, a licensure ladder, an apprenticeship progression, or a civil-service pay scale. This page measures the slopes and then sorts the fields by what kind of escalator, if any, sits behind them.
Stacking is a weak signal in any case, and the federal rule treats it as conditional. The final rule requires a stackable, portable credential only where the credential is not the terminal one for the occupation. A program is exempt from the stackable-and-portable test when it leads to the sole recognized postsecondary credential required for the job, one set by statute, regulation, or a licensing authority with no alternate. So for the credentials that are already final, stacking is not required at all, which is one more reason it does not separate the fields that climb from the fields that stay flat.
Three ways a credential stays flat, and one way it climbs
A ladder without raises. Childcare is the cleanest case, and we have measured it in detail: the credential sequence stacks formally, from short certificate through associate's to bachelor's, and the earnings distributions overlap almost completely at every level. The certificate trajectory here tells the same story over time: $27,569 in year one, $34,656 in year ten, 26 percent real growth that is the weakest of the twelve fields. The ten-year graduate converges almost exactly to the childcare-worker occupation median ($34,980), which is to say the ceiling is the occupation itself. Stacking exists; the escalator does not.
Raises locked behind a wall. The healthcare entry tracks, mapped on our healthcare pathways page, fail in the opposite way. Medical assisting certificates grow a respectable 49 percent real, but the destination is the occupation's own ceiling: $45,751 at year ten against a $45,690 medical assistant median. Dental assisting behaves identically ($45,210 at year ten against a $48,070 occupation median). The large wage step in healthcare exists, one licensure rung up at LPN and RN, and the short credentials Workforce Pell can fund do not connect to it.
Neither. Commercial driving is the canonical short-term workforce program, the example cited in a decade of short-term Pell debates, and its slope is tied with childcare for the flattest of the twelve: $43,920 in year one, $55,007 in year ten, 25 percent real growth. The occupation median for heavy and tractor-trailer drivers ($58,640) sits just above the ten-year graduate figure, which says the flatness is the occupation, not the graduates: there is no rung above a CDL-A. A CDL program clears the federal earnings test easily in year one and has the least room to move afterward.
The escalator without stacking. The construction and mechanical trades climb more than any other certificate field, and none of it comes from stacking credentials. Vehicle maintenance grows 73 percent real ($33,582 to $58,019), welding 59 percent, HVAC 48 percent, electrical 56 percent ($50,767 to $79,345). The escalator is institutional: registered apprenticeship, journeyman and master licensure, and experience premiums negotiated into the occupation's labor market. Criminal justice certificates (61 percent growth, to $67,570) show the public-sector version, where civil-service pay scales do the same work. These fields would look identical to childcare and CDL on the federal test in year one. They are different careers entirely by year ten.
What this means for the stackability debate
The research consensus that credential stacking pays, especially in healthcare, is about vertical stacking that ends in a degree. That finding and this page agree: the earnings action is in the climb, not the credential count. Where the climb runs through structures a 599-clock-hour program cannot reach (nursing licensure, a bachelor's degree), short credentials are entry tickets, not first rungs. Where the climb runs through the occupation itself (apprenticeship, journeyman cards, civil service), short credentials inherit the slope for free. "Does it stack" is the wrong screening question. "What escalator does this occupation attach to" is the right one, and it is answerable from public data before a program is approved.
The in-demand test counts exits
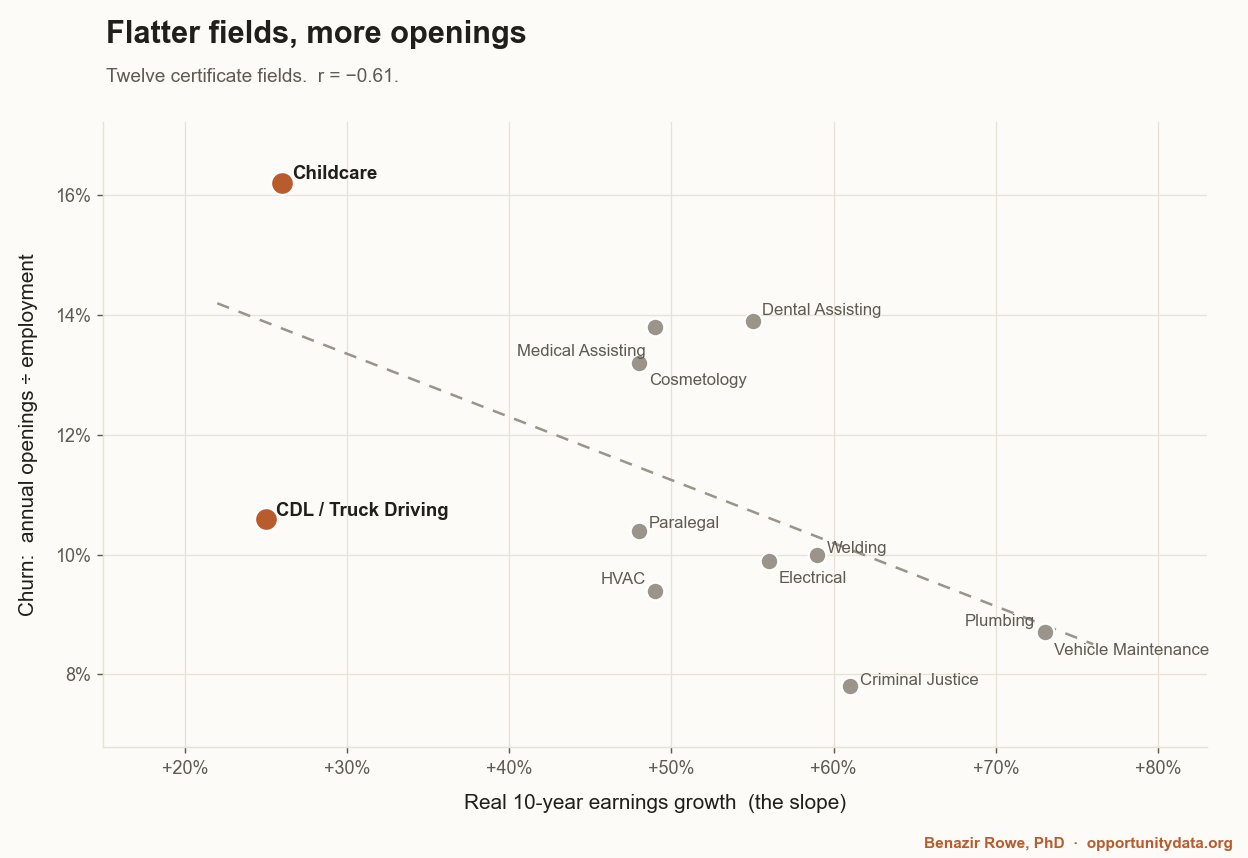
Workforce Pell programs must serve occupations states identify as high-skill, high-wage, or in-demand, and "in-demand" is operationalized almost everywhere with projected job openings. Openings are a flow with two sources: growth in the occupation, and replacement of workers who leave. For most occupations the replacement share dominates, and for the flattest fields on this page it is nearly everything. Childcare projects 160,200 openings a year against a workforce of 991,600, one opening for every six workers annually, while the occupation itself is projected to shrink. By the openings yardstick, childcare looks like one of the most in-demand fields a state can approve. What the number is measuring is the rate at which people quit.
The supply side has the same blind spot in reverse. Certificate production bears little relationship to openings: cosmetology programs produce 172 certificates for every 100 projected openings, while plumbing produces 6. Both extremes are informative. Oversupply helps explain why cosmetology wages sit at $36,923 ten years out despite a "faster than average" growth label, and scarce plumbing completions, feeding an apprenticeship pipeline, are part of why that line climbs to $100,721.
| Field |
Annual openings (2024-34) |
Employment (2024) |
Churn: openings ÷ employment |
Certificates (2022-23) |
Certificates per 100 openings |
Growth outlook |
| Childcare | 160,200 | 991,600 | 16.2% | 19,581 | 12 | Declining |
| Dental Assisting | 52,900 | 381,900 | 13.9% | 15,542 | 29 | 5-6% |
| Medical Assisting | 112,300 | 811,000 | 13.8% | 60,880 | 54 | 7% or higher |
| Cosmetology | 75,800 | 575,200 | 13.2% | 130,726 | 172 | 5-6% |
| CDL / Truck Driving | 237,600 | 2,235,100 | 10.6% | 24,018 | 10 | 3-4% |
| Paralegal | 39,300 | 376,200 | 10.4% | 4,323 | 11 | Little or no change |
| Welding | 45,600 | 457,300 | 10.0% | 54,433 | 119 | 1-2% |
| Electrical | 81,000 | 818,700 | 9.9% | 25,789 | 32 | 7% or higher |
| HVAC | 40,100 | 425,200 | 9.4% | 19,277 | 48 | 7% or higher |
| Plumbing | 44,000 | 504,500 | 8.7% | 2,508 | 6 | 5-6% |
| Vehicle Maintenance | 70,000 | 805,600 | 8.7% | 51,444 | 73 | 3-4% |
| Criminal Justice | 30,100 | 387,500 | 7.8% | 22,739 | 76 | Declining |
Openings, employment, and growth outlook: BLS Employment Projections 2024-2034, as republished by O*NET OnLine (each field name links to its O*NET page). Openings are annual average occupational openings, growth plus replacement; growth outlook is the projected net change in total employment over the decade, in O*NET's category labels. The employment base includes self-employment, so it differs from the OEWS counts above. Certificates: IPEDS 2022-23 sub-associate certificate completions (first majors) in the matching 4-digit CIP. Sorted by openings as a share of employment, a rough churn measure. Two caveats run large: IPEDS misses non-Title IV providers, which undercounts CDL training badly, and criminal justice completers feed police and security occupations beyond the correctional officers shown.
The growth outlook column is the key to reading the openings column. Growth outlook counts only net new jobs, the projected change in total employment over the decade. Openings add replacement of workers who leave. Where the two diverge, the difference is churn. Childcare shows a declining outlook next to 160,200 annual openings, so every one of those openings is a replacement seat. Welding's 45,600 openings sit on 1-to-2-percent growth, again mostly replacement. HVAC and electrical show 7-percent-or-higher growth next to their openings, so a meaningful share of theirs are positions that did not exist before. One note on the churn column: it divides total openings by employment, so for the growing fields a slice of that ratio is new positions rather than turnover, while for flat or declining fields the ratio is turnover outright. The same openings column describes three different labor markets, and only the outlook column tells them apart.
Read together, the two tables say the in-demand label and the slope measure different things and can disagree sharply. The fields with the highest churn-driven openings cluster at the flat end of the earnings chart. The likely mechanism is the same one: wages that stop growing are one reason people leave, and the leaving is what generates the openings. An occupation can qualify for every state list in the country on a number that reflects, in substantial part, that flat trajectory.
The federal test measures the floor; states own the slope
Nothing in the statute or the final rule evaluates earnings growth, and at one level that is reasonable: a floor test is enforceable, and a slope test on a brand-new program is not, since the ten-year outcome does not exist yet for the program's own completers. But the slope of the destination occupation is knowable today, from exactly the kind of public data on this page, and the program approval pipeline has a place for it. States identify eligible occupations and governors approve specific programs before anything reaches the U.S. Department of Education. A state that wants Workforce Pell to function as mobility policy rather than placement policy can weight occupation-level wage trajectories in that screening. A state that does not will still pass the federal test, and its completers will still be at $55,000 a decade later.
The practical version of the screen is short: for each candidate occupation, does an escalator exist (licensure ladder, registered apprenticeship, civil-service scale, degree pathway with measured returns), and does the proposed credential connect to it? Two of the twelve fields here fail the first question outright. Several pass the first and fail the second. The federal test catches none of that, by design. It was never asked to.
Graduate trajectories are Census PSEO medians of institution-level medians, certificate level, pooled cohorts, covering the roughly 25 participating states in constant 2023 dollars (CPI-U-adjusted, so growth figures are real). Occupation medians and employment are BLS OEWS May 2025, retrieved through the BLS Public Data API. Field-to-occupation mappings, thin-cell warnings (plumbing's year-10 estimate rests on 5 institutions), CIP rollup caveats, and dollar-unit notes are documented in the methodology note.
Read the methodology note (PDF) →
Related: Healthcare Pathways · The Childcare Credential Ladder · Value-Added Test · Workforce Pell overview