Analysis · Recent Graduate Outcomes

The Earnings Record Cannot See the AI Shock Yet

A Census Bureau working paper published in September 2026 finds that bachelor's graduates in the top 10 percent of majors by AI exposure saw their chance of employment in the quarter after graduation fall five percentage points, and their starting earnings fall thirteen percent, once ChatGPT was released. In the same year, the first federal earnings test for every degree program took effect. Its first run, in early 2027, scores students who completed in award year 2021 on their 2025 earnings.

This page measures the gap between those two facts with public data. No public program-earnings record contains a cohort that graduated after November 2022. The newest, the College Scorecard's one-year earnings for 2020-21 and 2021-22 completers, measures 2023 earnings for graduates who entered the market just before the break, and it is the first program-level series to turn: within the same programs, real one-year earnings in the most exposed decile were flat while every other decile gained. Across the two decades those records do cover, computing graduates had the strongest earnings growth of any group. The one public survey that can see graduates who finished after 2022 shows unemployment in the top 10 percent of majors ranked by the Opportunity Data AI Exposure Index going from 4.8 percent in 2022 to 9.1 percent in 2024, while pay for those who found work did not fall. Students have already responded: computer science enrollment fell by about an eighth this fall at both two-year and four-year institutions. The earnings test counts only graduates who are working, and cannot score a post-2022 cohort before 2029.
Unemployment, 2022 to 2024: top 10% of majors by AI exposure
↑4.3 pts+90%change
Bachelor's graduates aged 22 to 24, not enrolled, whose majors rank in the top 10 percent of the Opportunity Data AI Exposure Index
Unemployment, 2022 to 2024: bottom 60% of majors by AI exposure
↑0.4 pts+8%change
Same measure, same years, for graduates in the 60 percent of majors ranked lowest by the Opportunity Data AI Exposure Index. The gap opened in employment, not in pay.
When the test can see it
2029consequence 2031
First year the federal earnings test can score a cohort that graduated entirely after ChatGPT. The track runs from the 2022 release, through the first test run in 2027, to the earliest penalty in 2031.
Students are already moving
↓12.4%computer science, fall 2026
One-year change in Computer and Information Science enrollment, preliminary Clearinghouse data released October 29, 2026
Health keeps growing
↑4.3%two-year colleges, fall 2026
One-year change in Health enrollment, preliminary Clearinghouse data released October 29, 2026
Skilled trades keep growing
↑6.1%mechanic and repair technologies, fall 2026
One-year change in mechanic and repair technologies enrollment, as reported by Community College Daily from the Clearinghouse dashboard, with Health at two-year colleges for comparison

Two shocks, and the data behind each

The Census paper measures the chatbot shock of 2022. The agentic systems of spring 2026 appear in none of its data, in no public survey, and in no earnings record the accountability system will use before the next decade.

Orr, Tucker, and Warren of the Census Bureau's Center for Economic Studies linked 6.67 million bachelor's graduates, 29 percent of all bachelor's degrees conferred from 2016 to 2024, to employer-reported earnings, and classified their majors by the share of tasks a 2023 language model could perform (CES-WP-26-56). Outcomes for the most exposed decile diverged from other graduates immediately after November 2022: employment in the first quarter after graduation fell five percentage points, initial earnings fell thirteen percent, and two years out earnings remained 3.3 log points lower. The authors compare the size of the effect to graduating into a large recession.

The event the paper dates is the public release of a chatbot, and its earnings series end in mid-2025. The Opportunity Data AI Exposure Index is built on a later frontier: the systems evident by spring 2026 that write and run software, operate computers, and complete multi-step work end to end, a capability shift documented by independent measurement (METR, Time Horizon 1.1, January 2026). Those systems do not appear in the Census paper's data, in the survey years used on this page, or in any public source. Every number below therefore describes graduates' experience of the smaller and earlier of two shocks.

SourceEvent it datesLast observationFirst observation of the spring 2026 break
Census working paper CES-WP-26-56ChatGPT, November 2022Mid-2025 (restricted data)Not in the paper
American Community Survey, field of degreeChatGPT, November 2022Calendar 2024; the 2025 file is not yet posted2026 survey year, released late 2027
Census PSEO, release R2026Q2None2019 to 2021 graduating cohortAround 2029
College Scorecard field of study, October 2026NoneAward years 2020-21 and 2021-22 completers, earnings in 2022 and 2023Around 2030
Federal earnings test, first run early 2027NoneAward year 2021 completers, tax year 2025 earnings2031 calculation, on award year 2026 completers

Sources: Census Bureau working paper CES-WP-26-56 (September 2026); Census Bureau PSEO documentation, release R2026Q2; College Scorecard data dictionary, FieldOfStudy_Cohort_Map sheet, October 15, 2026 release; U.S. Department of Education, "Timeline for Implementing the Earnings Test," January 7, 2026; 34 CFR 668.2 and 668.403. The ACS 2025 one-year file was not posted as of October 28, 2026; the Census paper notes the same.

What has happened to recent graduates since 2022

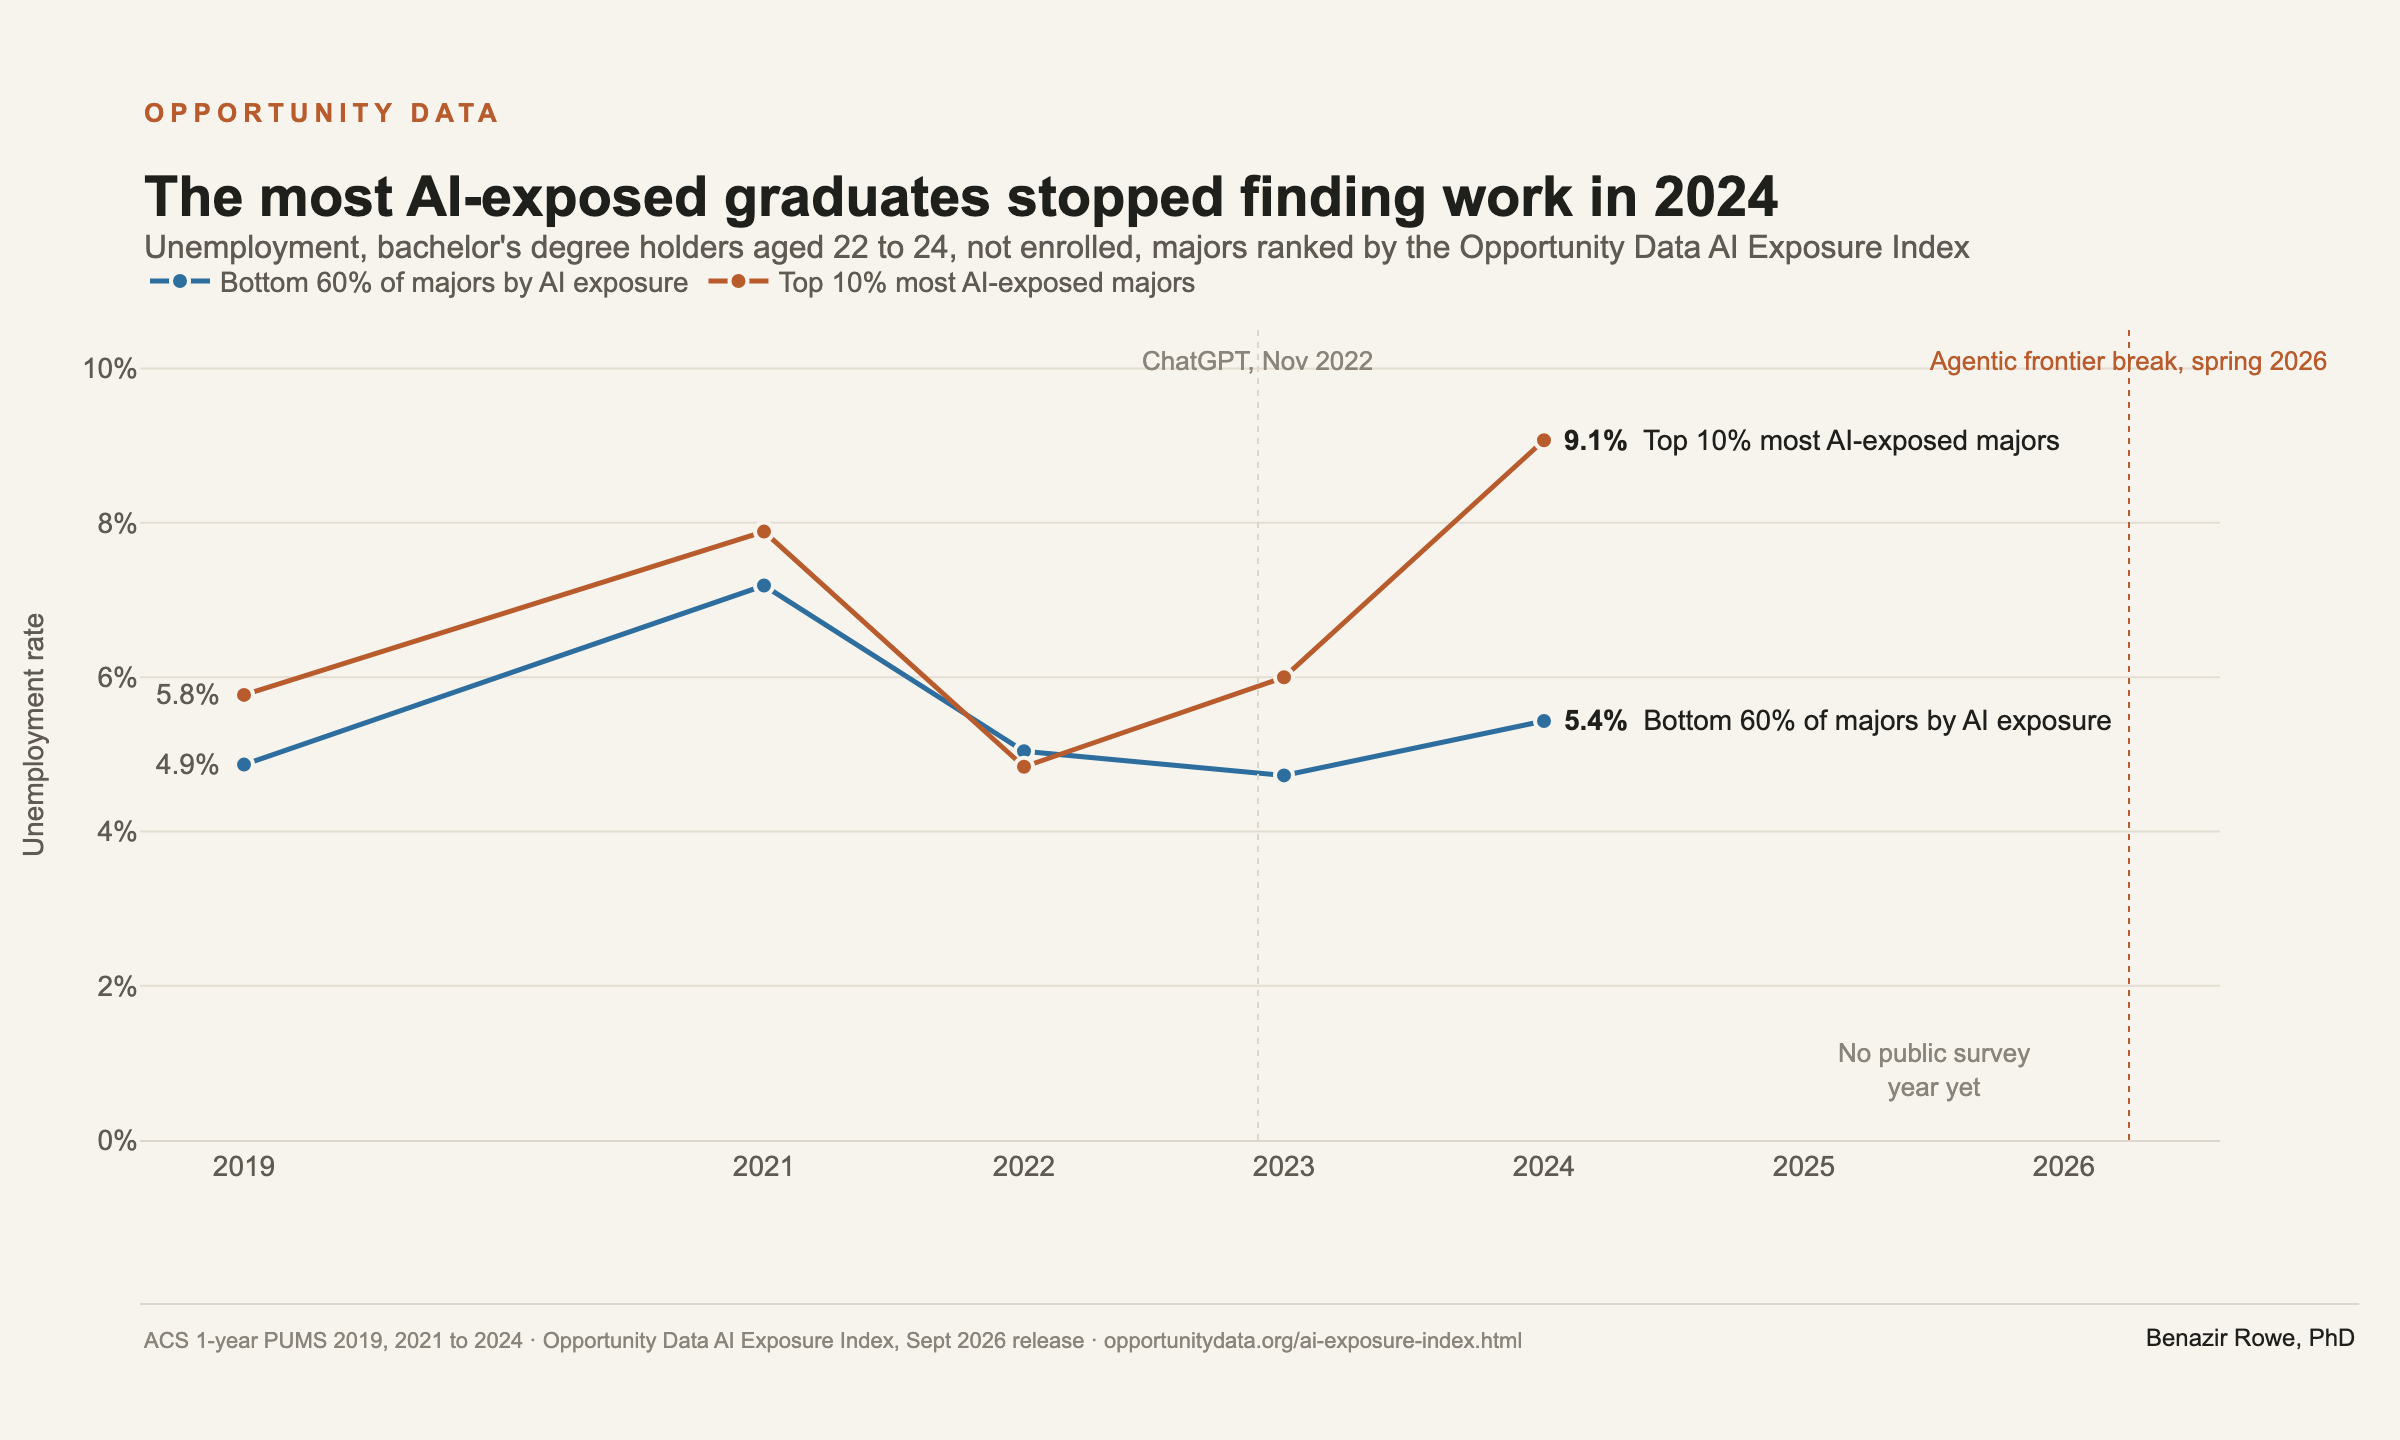
The American Community Survey is the only public source that records field of degree for graduates who finished after November 2022. The 2019 and 2021 through 2024 one-year microdata were restricted to respondents holding exactly a bachelor's degree, not enrolled, aged 22 to 24, the closest survey approximation to the Census paper's new entrants. Majors were grouped by the Opportunity Data AI Exposure Index, carried from academic programs to the survey's 174 field-of-degree codes through a hand-built crosswalk, with deciles weighted by graduate counts.

Line chart of unemployment rates, 2019 to 2024, for bachelor's degree holders aged 22 to 24, majors ranked by AI exposure. The top 10 percent line, terracotta, sits near the bottom 60 percent line, blue, through 2022 at about 5 percent, then separates: 6.0 percent in 2023 and 9.1 percent in 2024 against 4.7 and 5.4 percent. A dotted vertical line marks ChatGPT, November 2022; a second dotted line at spring 2026 marks the agentic frontier break, beyond the end of the data.
Unemployment, bachelor's-only graduates aged 22 to 24, not enrolled, by Opportunity Data AI Exposure Index decile of major. ACS one-year PUMS, 2019 and 2021 to 2024, person-weighted. The 2020 one-year file was not released.

The top 10 percent of majors by AI exposure, which is the computing fields, computer and electrical engineering, and a handful of quantitative social sciences, tracked the bottom 60 percent through 2022. The two series then separated. Under the Census paper's own exposure grouping the top decile moves from 5.5 to 9.0 percent over the same years, so the result does not depend on which measure assigns the majors.

Survey yearTop decile, Opportunity Data indexDeciles 1 to 6, Opportunity Data indexTop decile, Census paper groupingDeciles 1 to 6, Census paper grouping
20195.8%4.9%6.2%4.7%
20217.9%7.2%7.6%6.9%
20224.8%5.0%5.5%5.1%
20236.0%4.7%6.3%4.8%
20249.1%5.4%9.0%5.4%

Unemployment rate among bachelor's-only graduates aged 22 to 24, not enrolled. The Census paper grouping uses the Eloundou GPT-4 exposure deciles reported in the paper's Appendix Table A3. Sample sizes per cell are 2,000 to 2,700 respondents in the top decile and 9,200 to 10,000 in deciles 1 to 6 under the Opportunity Data grouping.

Pay for those who found work did not fall. Among full-time, full-year workers aged 22 to 27 in the top 10 percent of majors ranked by the Opportunity Data AI Exposure Index, pay at the bottom, the lower quarter, the middle, and the upper quarter of the group is within three percent of its 2019 level in constant dollars, and pay at the top tenth of the group rose ten percent, all of it in 2024. The adjustment is on the employment margin: graduates who got jobs in these fields were paid as before or better, and fewer got jobs. The Census paper's decomposition points the same way, with part of its earnings loss coming from graduates moving into lower-wage sectors rather than from lower pay within the field.

Survey yearLowest-paid 10% earn belowLowest-paid 25% earn belowMedian wageHighest-paid 25% earn aboveHighest-paid 10% earn above
2019$37,200$53,300$80,600$99,200$133,900
2022$36,900$55,900$78,200$100,600$139,700
2024$38,600$56,900$81,200$101,500$147,200

Annual wages inside one group: full-time, full-year workers aged 22 to 27 holding exactly a bachelor's degree whose majors are in the top 10 percent ranked by the Opportunity Data AI Exposure Index. Each column is a point in that group's pay distribution, not an exposure decile. 2024 dollars.

What the public record shows for the same fields

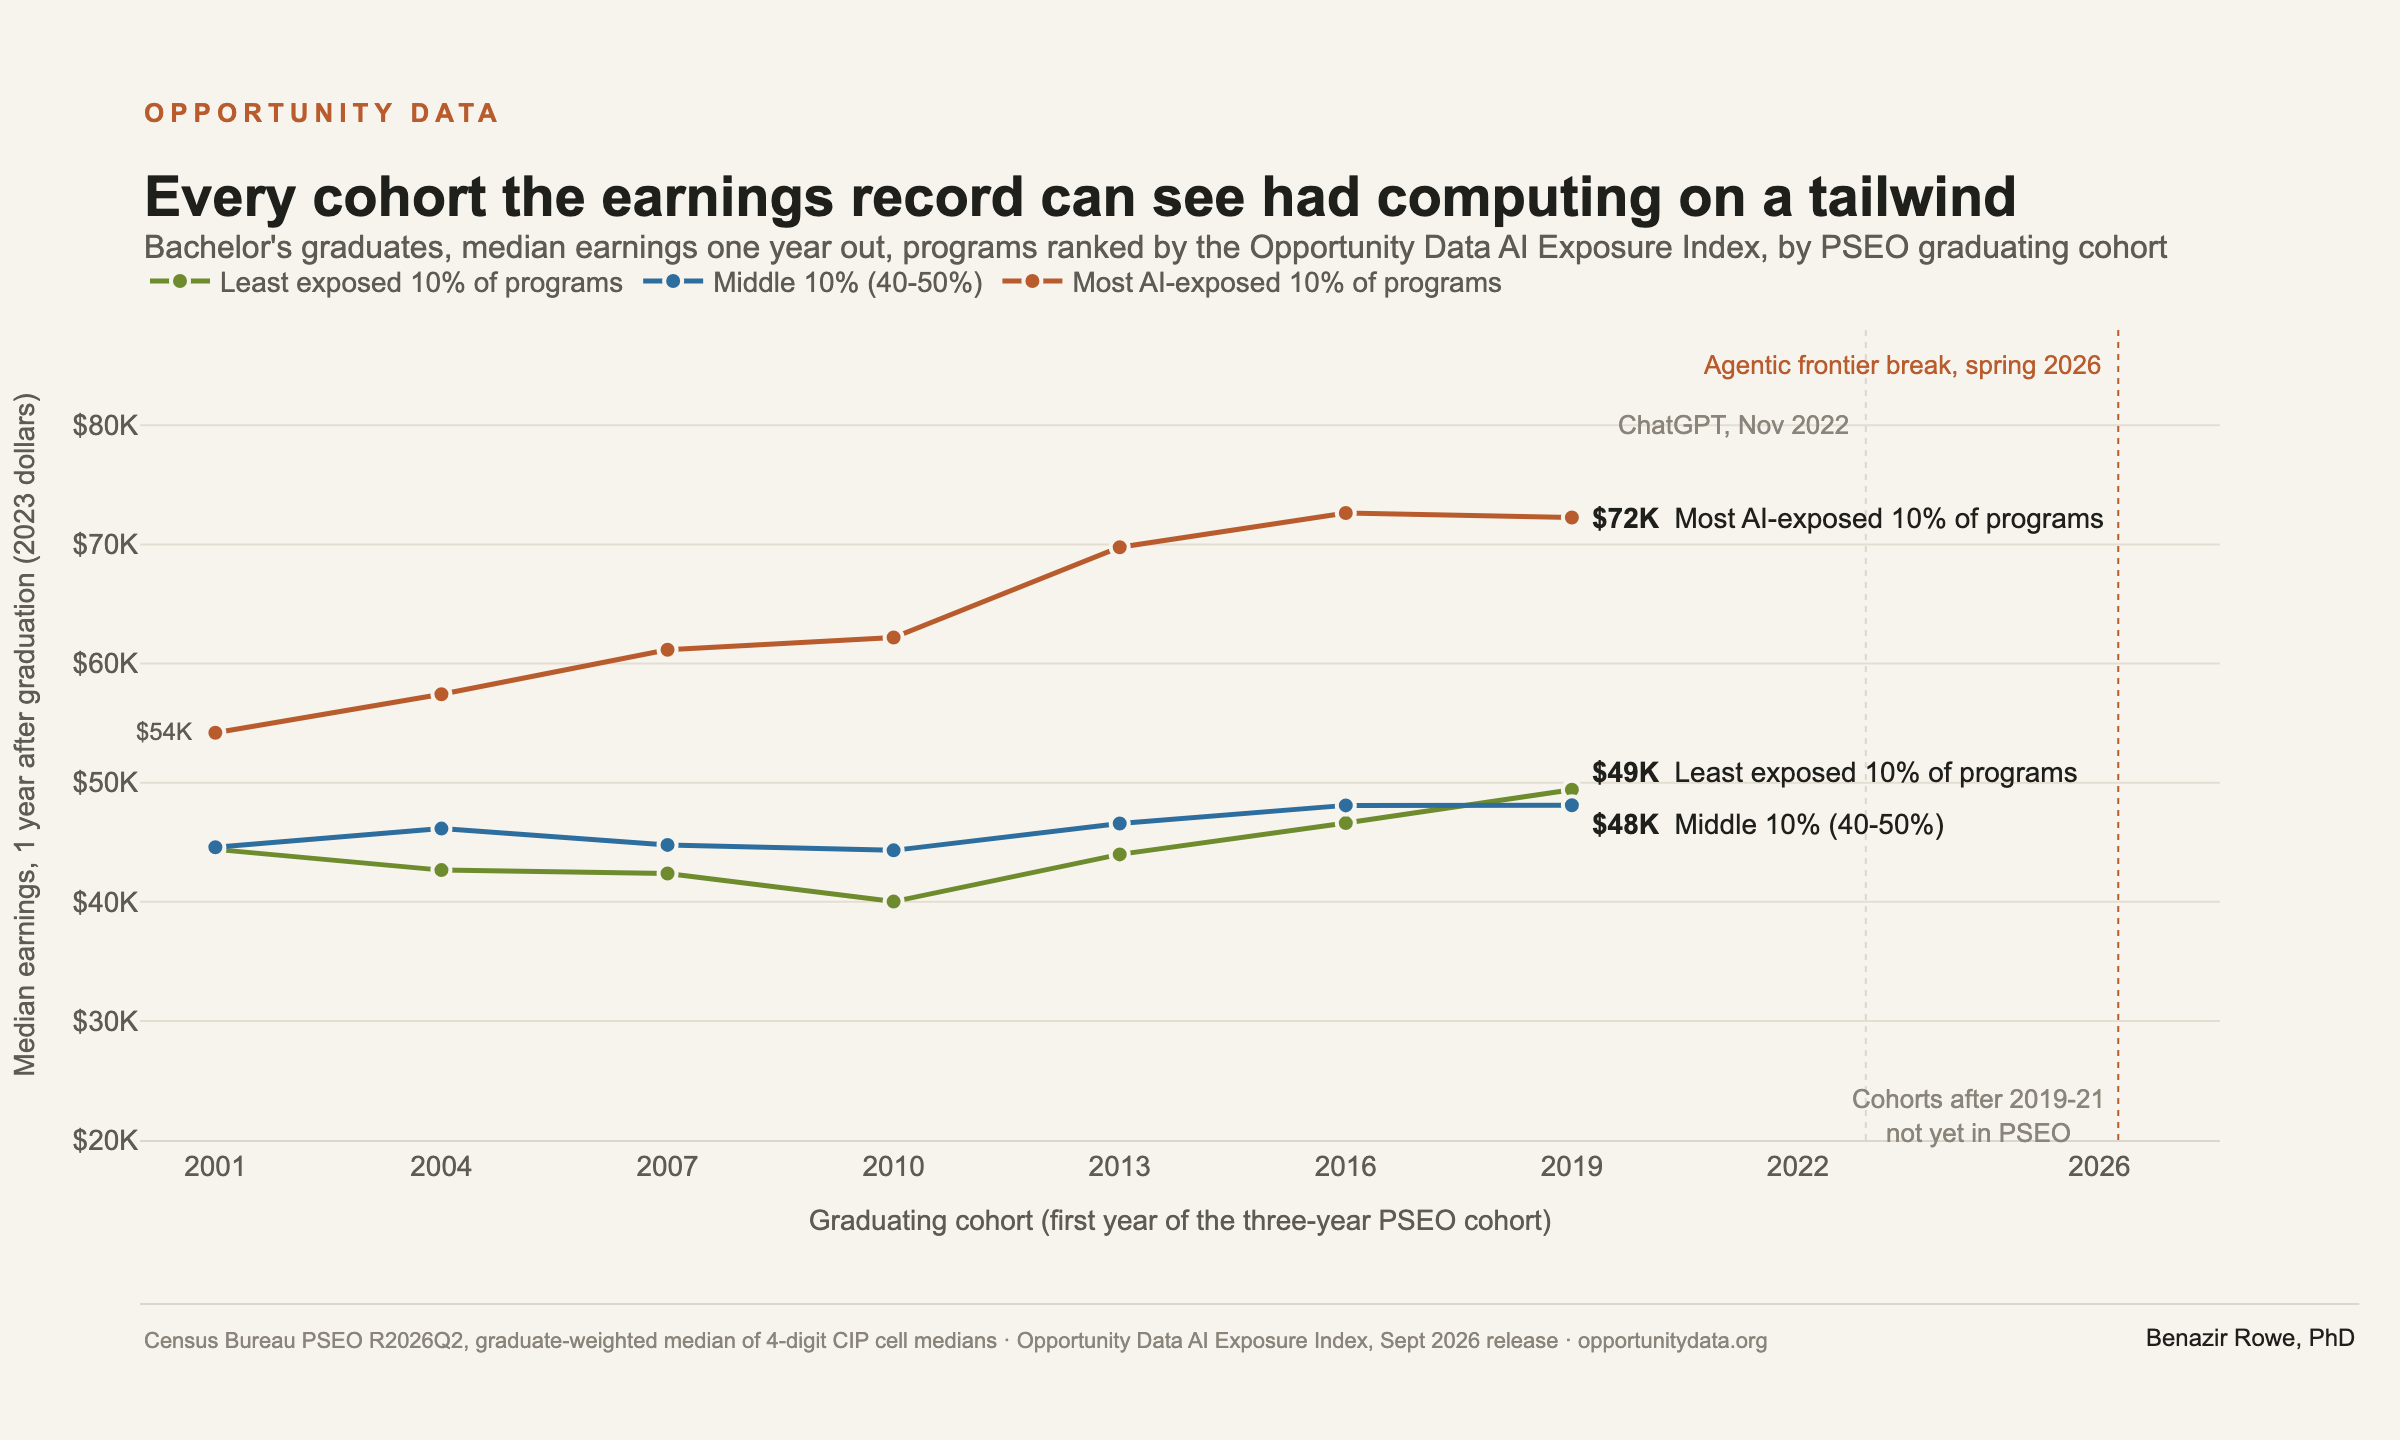
The Census Bureau's Post-Secondary Employment Outcomes series is the public program-level earnings record. Its latest bachelor's cohort graduated in 2019 to 2021. Grouping its 4-digit program cells by Opportunity Data AI Exposure Index decile and taking the graduate-weighted median of cell medians gives the following history of one-year earnings, in constant 2023 dollars.

Line chart of median earnings one year after graduation, in 2023 dollars, for bachelor's graduates by PSEO graduating cohort from 2001 to 2019, for three groups of programs ranked by AI exposure. The most exposed 10 percent, terracotta, rises from 54 thousand to 72 thousand dollars. The middle 10 percent, blue, moves from 45 to 48 thousand. The least exposed 10 percent, olive, moves from 44 to 49 thousand. Dotted lines mark ChatGPT in November 2022 and the agentic frontier break in spring 2026, both beyond the last cohort in the data.
Median earnings one year after graduation, bachelor's, real 2023 dollars, by Opportunity Data AI Exposure Index decile of program and three-year PSEO graduating cohort. Census Bureau PSEO release R2026Q2; graduate-weighted median of 4-digit CIP cell medians.
Graduating cohortTop 10% most exposed80-90%40-50%20-30%Bottom 10%
2001 to 2003$54,200$61,000$44,600$36,700$44,400
2007 to 2009$61,200$61,700$44,800$36,300$42,400
2013 to 2015$69,800$61,500$46,600$35,200$44,000
2019 to 2021$72,300$64,300$48,100$36,800$49,400
Change, 2001 to 2019 cohorts+33%+5%+8%0%+11%

Across the two decades the record covers, the most exposed decile gained a third in real one-year earnings while the middle deciles stayed flat, and the same ordering holds five and ten years out. Within that top group, earnings also compressed: the 25th percentile rose 39 percent and the 75th rose 17 percent, so the floor rose faster than the ceiling. Every cohort the accountability system can currently see was formed in the strongest sustained period computing graduates have had. The Census paper dates the break to the first cohort the record does not yet contain.

Students are already moving

The National Student Clearinghouse Research Center's preliminary fall 2026 enrollment report, released October 29, 2026, shows the field the record rates most favorably losing students faster than any other. Enrollment in Computer and Information Science programs fell 12.4 percent at four-year institutions, 12.3 percent at two-year institutions, and 10.4 percent at the graduate level in a single year, while total undergraduate enrollment rose 0.6 percent, Health rose at every level, and the skilled-trades field the Clearinghouse reports, mechanic and repair technologies, rose 6.1 percent. Community College Daily's same-day report on the release, drawing on the Clearinghouse dashboard, puts the two-year decline at 18.4 percent for undergraduate computer science at four-year institutions and 17.5 percent at two-year colleges, after a 5.9 percent drop at two-year colleges last fall.

Enrollment, fall 2026 against fall 2025Four-year undergraduateTwo-year undergraduateGraduate
Computer and Information Science−12.4%−12.3%−10.4%
Health+6.2%+4.3%+2.0%
All students+0.3% (public four-year)+1.2% (community colleges)−1.6%

National Student Clearinghouse Research Center, Preliminary Fall 2026 Enrollment Trends, October 29, 2026: about 7.92 million enrollments reported as of September 24, 2026 by 46.0 percent of participating institutions; fields are two-digit CIP families; estimates are preliminary and final figures are due in January 2027. Two-year cumulative changes and the mechanic and repair technologies figure are as reported by Community College Daily from the Clearinghouse dashboard.

The Clearinghouse report offers no explanation for the decline, and this page does not estimate one. The timing is what matters for the accountability design. Enrollment in the most exposed field fell in the same two years in which unemployment among its recent graduates doubled, which is consistent with students responding to conditions the earnings record does not yet show. A program that loses an eighth of its students a year will fall below the 30-completer threshold sooner, and when it does, the cohort-expansion rule scores it on completers from the seventh prior award year. The test will reach these programs years after their students did, and will judge them on graduates from before the change.

The first program-level earnings after the break

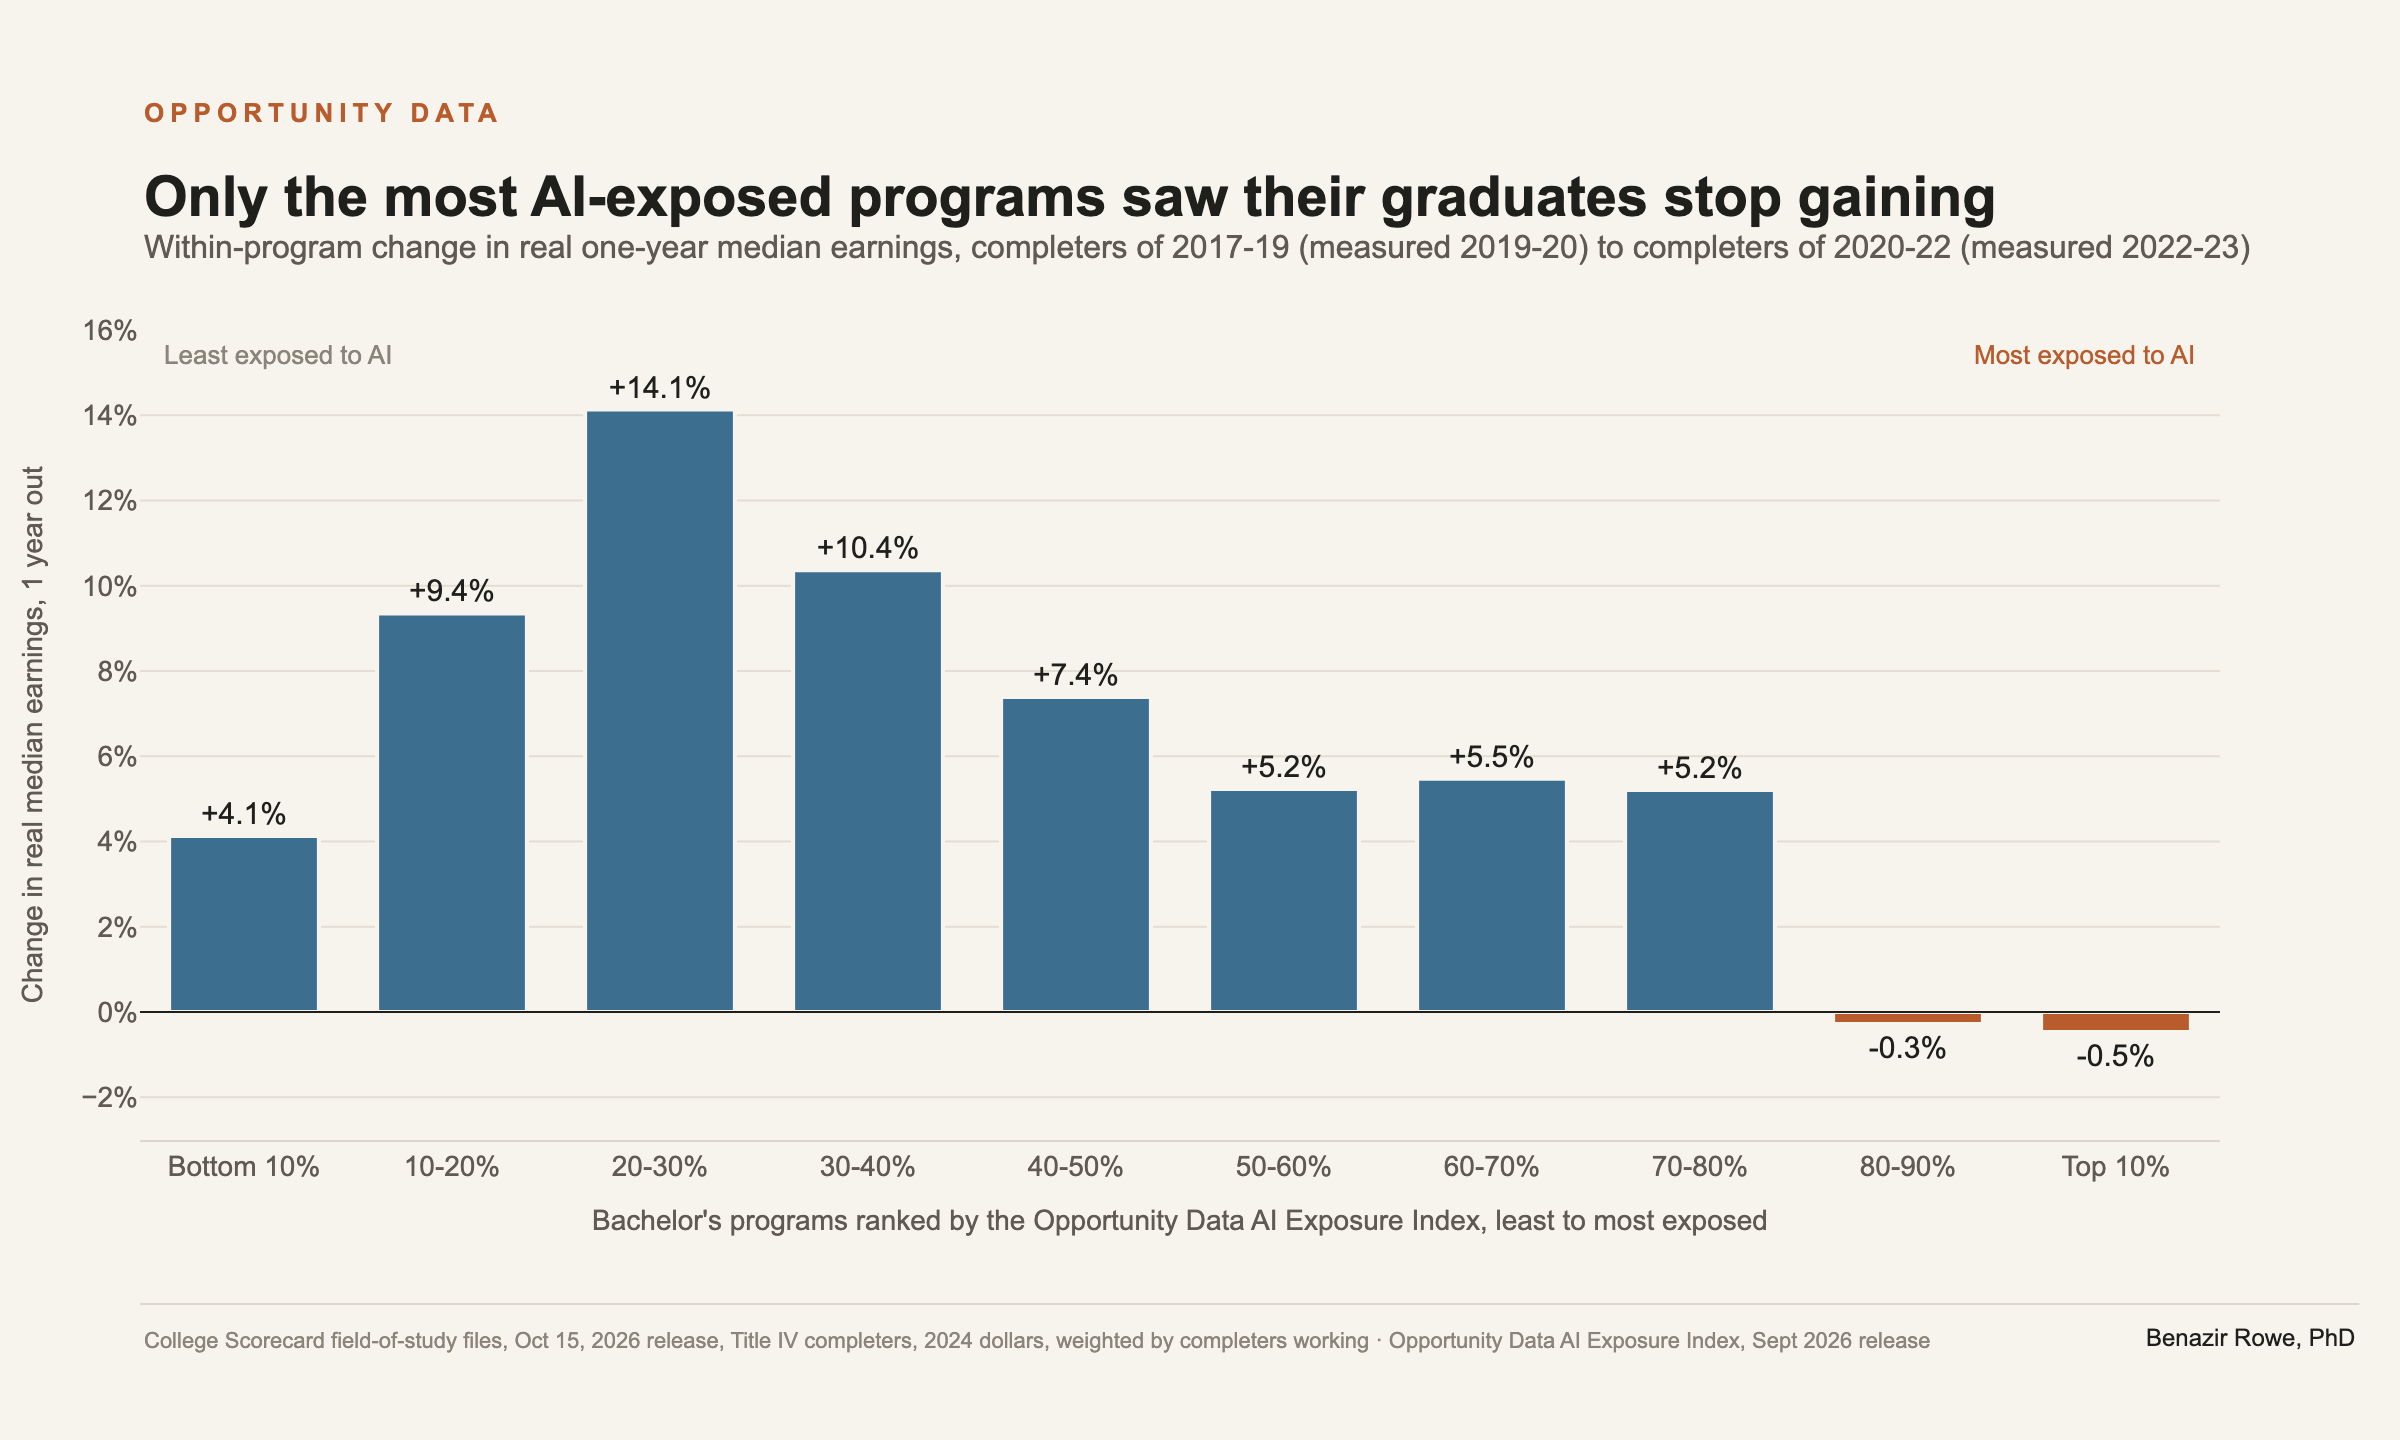
The College Scorecard field-of-study files are the one public program-level series with an earnings year after November 2022. The October 15, 2026 release carries three one-year earnings cohorts for bachelor's programs: completers of award years 2017-18 and 2018-19 measured in 2019 and 2020, completers of 2018-19 and 2019-20 measured in 2020 and 2021, and completers of 2020-21 and 2021-22 measured in 2022 and 2023. The last of these is the first program-level earnings measurement that reaches past the break, for graduates who entered the market just before it. Restricting to programs present in both the first and last cohorts, deflating to 2024 dollars, and weighting by completers working gives the change in real one-year median earnings within the same programs, by Opportunity Data AI Exposure Index decile.

Bar chart of within-program change in real one-year median earnings by AI exposure decile, College Scorecard, completers of 2017 to 2019 measured in 2019 and 2020 against completers of 2020 to 2022 measured in 2022 and 2023. The bottom 80 percent of programs by exposure rise between 4 and 14 percent. The top 20 percent, the most exposed, are flat at minus 0.3 and minus 0.5 percent.
Within-program change in real one-year median earnings, bachelor's programs, College Scorecard field-of-study files, October 15, 2026 release. Programs matched on institution and 4-digit CIP across the two cohorts; 2024 dollars; weighted by completers working. Title IV aided completers only.
Completer cohort (earnings years)Top 10% most exposed80-90%40-50%20-30%Bottom 10%
2017-18, 2018-19 (2019, 2020)$72,000$66,500$47,300$35,500$74,500
2018-19, 2019-20 (2020, 2021)$70,700$66,900$48,400$34,700$80,200
2020-21, 2021-22 (2022, 2023)$69,700$68,500$53,000$38,400$81,300
Within-program change, first to last cohort−0.5%−0.3%+7.4%+14.1%+4.1%

Median of program medians weighted by completers working, real 2024 dollars; the Scorecard adjusts each cohort to the year after its last measurement year and the series here re-deflates to 2024 with CPI-U. The least exposed 10 percent of programs is dominated by nursing, which is why its level is high. Columns are groups of programs ranked by the Opportunity Data AI Exposure Index. The within-program row matches programs on institution and 4-digit CIP across the first and last cohorts (1,166 to 3,597 programs per group).

Across the three cohorts the most exposed 10 percent of programs is the only group whose real one-year median fell, from $72,000 to $69,700, while the groups between the 10th and 50th percentiles of exposure gained between 5 and 12 percent. Within the same programs the top 20 percent were flat and every other group gained, so the most exposed programs lost between 4 and 14 points of real one-year earnings relative to the rest. The Scorecard measures a full calendar year of earnings for Title IV aided completers, so this is a wage-and-hours margin rather than the survey's unemployment margin, and the most recent cohort is only half post-break. It is nonetheless the first time the program-level record has moved in the direction the Census paper describes, and the record that moved is the one the earnings test will read next.

Why the earnings test cannot register it

The One Big Beautiful Bill Act of 2025 created a low-earning-outcome test for degree programs, and the Department of Education's final rule of July 1, 2026 (91 FR 40136) set the mechanics. A program's completers must have median earnings, in the fourth tax year after completion and counting only those who work, above the median for adults aged 25 to 34 in the same state with only a high school diploma (34 CFR 668.403). A program that fails in two of any three consecutive award years loses Direct Loan eligibility (34 CFR 668.603). Three features of that design determine when, if ever, the test will register the change in the section above.

  1. The measurement point. The fourth tax year after completion means a cohort entering the market in 2023 is measured in 2027 and scored in 2029. The first cohort that graduated entirely after ChatGPT, award year 2023, cannot be scored before the 2029 calculation; two failing years out of three puts any consequence at 2031 or later. For the agentic systems of spring 2026 the arithmetic runs one step further: the first cohort entirely after that break, award year 2026, is measured in tax year 2030, scored in 2031, and can face a consequence no earlier than 2033.
  2. The cohort expansion. When a program has fewer than 30 completers, the cohort period reaches back to the fifth, then the sixth and seventh prior award years, and then pools programs in the same 4-digit CIP and credential level (34 CFR 668.2). A small computer science program evaluated in 2029 can be scored on completers from 2019.
  3. The exclusion of non-workers. The survey evidence and the Census decomposition agree that the margin that moved first is employment. A median over workers only is, by construction, unresponsive to a rise in the share who are not working, and the benchmark on the other side of the comparison, the state median for high-school-only workers aged 25 to 34, is also a median over workers. The test is a floor on pay conditional on having a job. It was not designed to detect a change in the odds of having one.
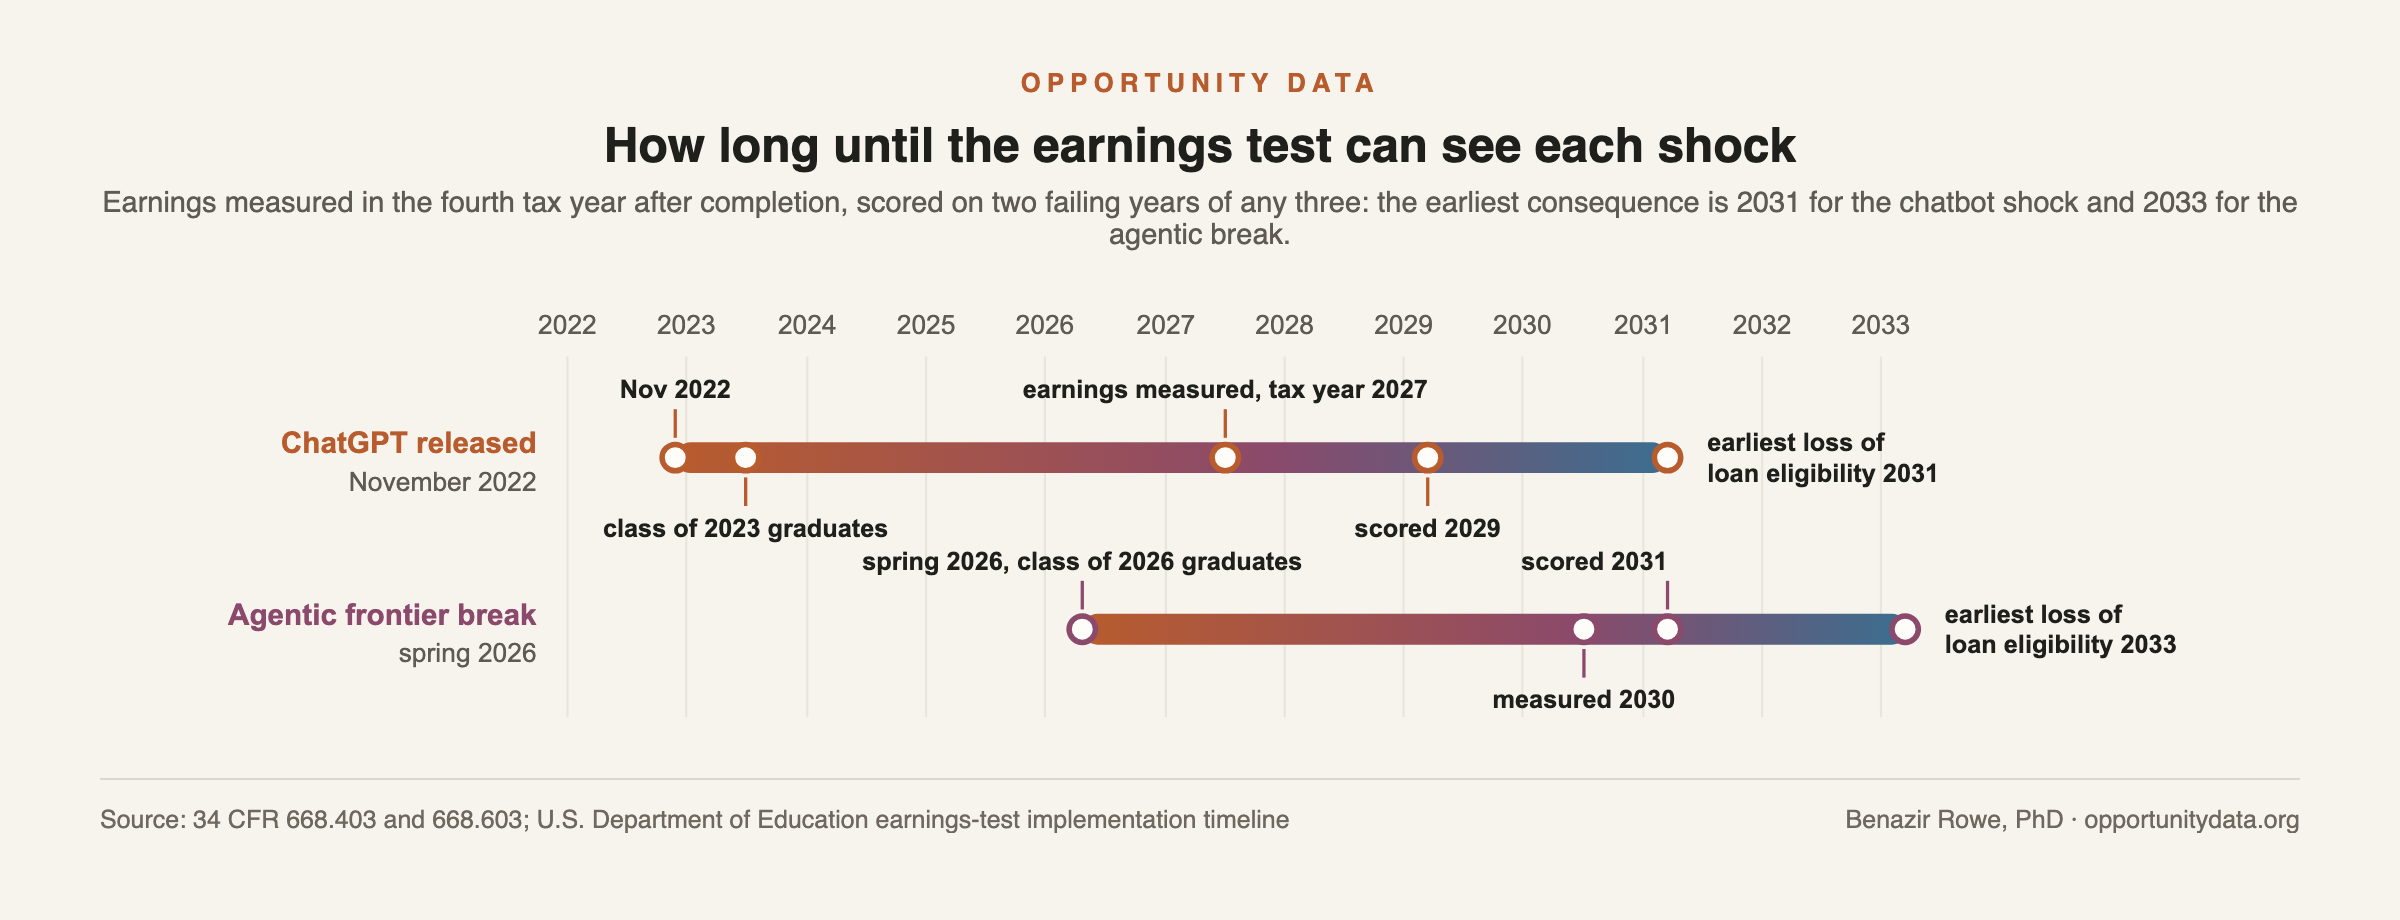
How long until the earnings test can see each shock

Each bar runs from the event to the earliest year a program could lose Direct Loan eligibility because of graduates who entered the market after it. The test measures earnings in the fourth tax year after completion and requires two failing years out of three.

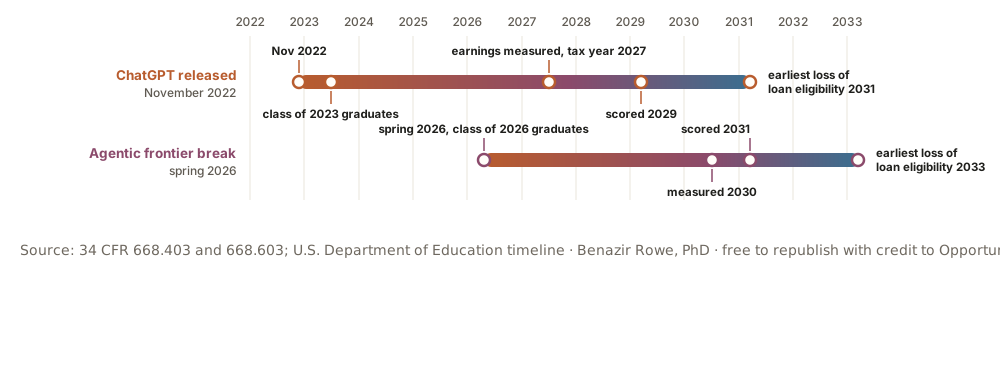
202220232024202520262027202820292030203120322033ChatGPT releasedNovember 2022Nov 2022class of 2023 graduatesearnings measured, tax year 2027scored 2029earliest loss ofloan eligibility 2031Agentic frontier breakspring 2026spring 2026, class of 2026 graduatesmeasured 2030scored 2031earliest loss ofloan eligibility 2033

Download: PNG · SVG · free to republish with credit to Opportunity Data.

EventFirst award-year cohort entirely after itEarnings measured (tax year)Earliest scoringEarliest consequence
ChatGPT, November 20222023202720292031
Agentic frontier break, spring 20262026203020312033

Lag arithmetic under 34 CFR 668.403(b)(1) (fourth tax year after completion) and 668.603(a) (two failing years of any three consecutive), applied to the Department's published timeline, which scores award year 2021 completers on tax year 2025 earnings in early 2027. Earliest consequence assumes failing results in the first two years scored.

The rule already contains one acknowledgment that an earnings year can be non-comparable. Programs preparing students for tipped occupations receive neither a pass nor a fail for any year that uses tax-year 2025 or earlier earnings, because the federal tax treatment of tips changed (34 CFR 668.402(c)(3)). The Department has accepted, in principle, that a policy shock makes a measurement year unrepresentative.

Our assessment

The earnings test is calibrated to a labor market that no longer exists for a specific set of fields, and the lag is not noise: it has a sign. The fields the record rates most favorably are the fields in which recent-graduate unemployment has nearly doubled. An accountability system that also governs program approval should carry a current-conditions indicator alongside the lagged earnings record. Field-level unemployment among recent graduates from the American Community Survey is available every year, by field of degree, with a lag of under a year. None of this is an argument against earnings accountability.

How to read these numbers

Versioning and next validation

This page uses ACS one-year PUMS through survey year 2024, PSEO release R2026Q2, the College Scorecard field-of-study file of October 15, 2026, and the September 2026 release of the Opportunity Data AI Exposure Index. The enrollment figures are the Clearinghouse's preliminary fall 2026 estimates and will be replaced with the final January 2027 figures. The Scorecard series will be extended when the next field-of-study release adds the 2021-22 and 2022-23 completer cohort, the first measured entirely after the break. It will be rerun when the 2025 ACS one-year file is posted, which adds the first full survey year after the Census paper's data, and again when the 2026 file is released in late 2027, the first public observation of graduates who finished after the spring 2026 break. The next validation is the 2025 rerun: if the top-decile unemployment gap of 2024 persists or widens in 2025 under both groupings, the employment-margin finding stands; if it closes, this page will say so.

Methods and sources

Read the methodology note (PDF) →

Cite this analysis

Rowe, B. (2026, October). The earnings record cannot see the AI shock yet: Recent graduate outcomes by AI exposure and the federal earnings test. Opportunity Data. https://opportunitydata.org/recent-grad-ai-disruption.html

Methodology: Rowe, B. (2026, October). The earnings record and the AI shock: Methodology note. Opportunity Data. https://opportunitydata.org/briefs/recent-grad-ai-disruption-methodology.pdf

Released October 2026