Of Five AI Exposure Measures, the Opportunity Data AI Exposure Index Best Predicts the Unemployment Rise Since 2022
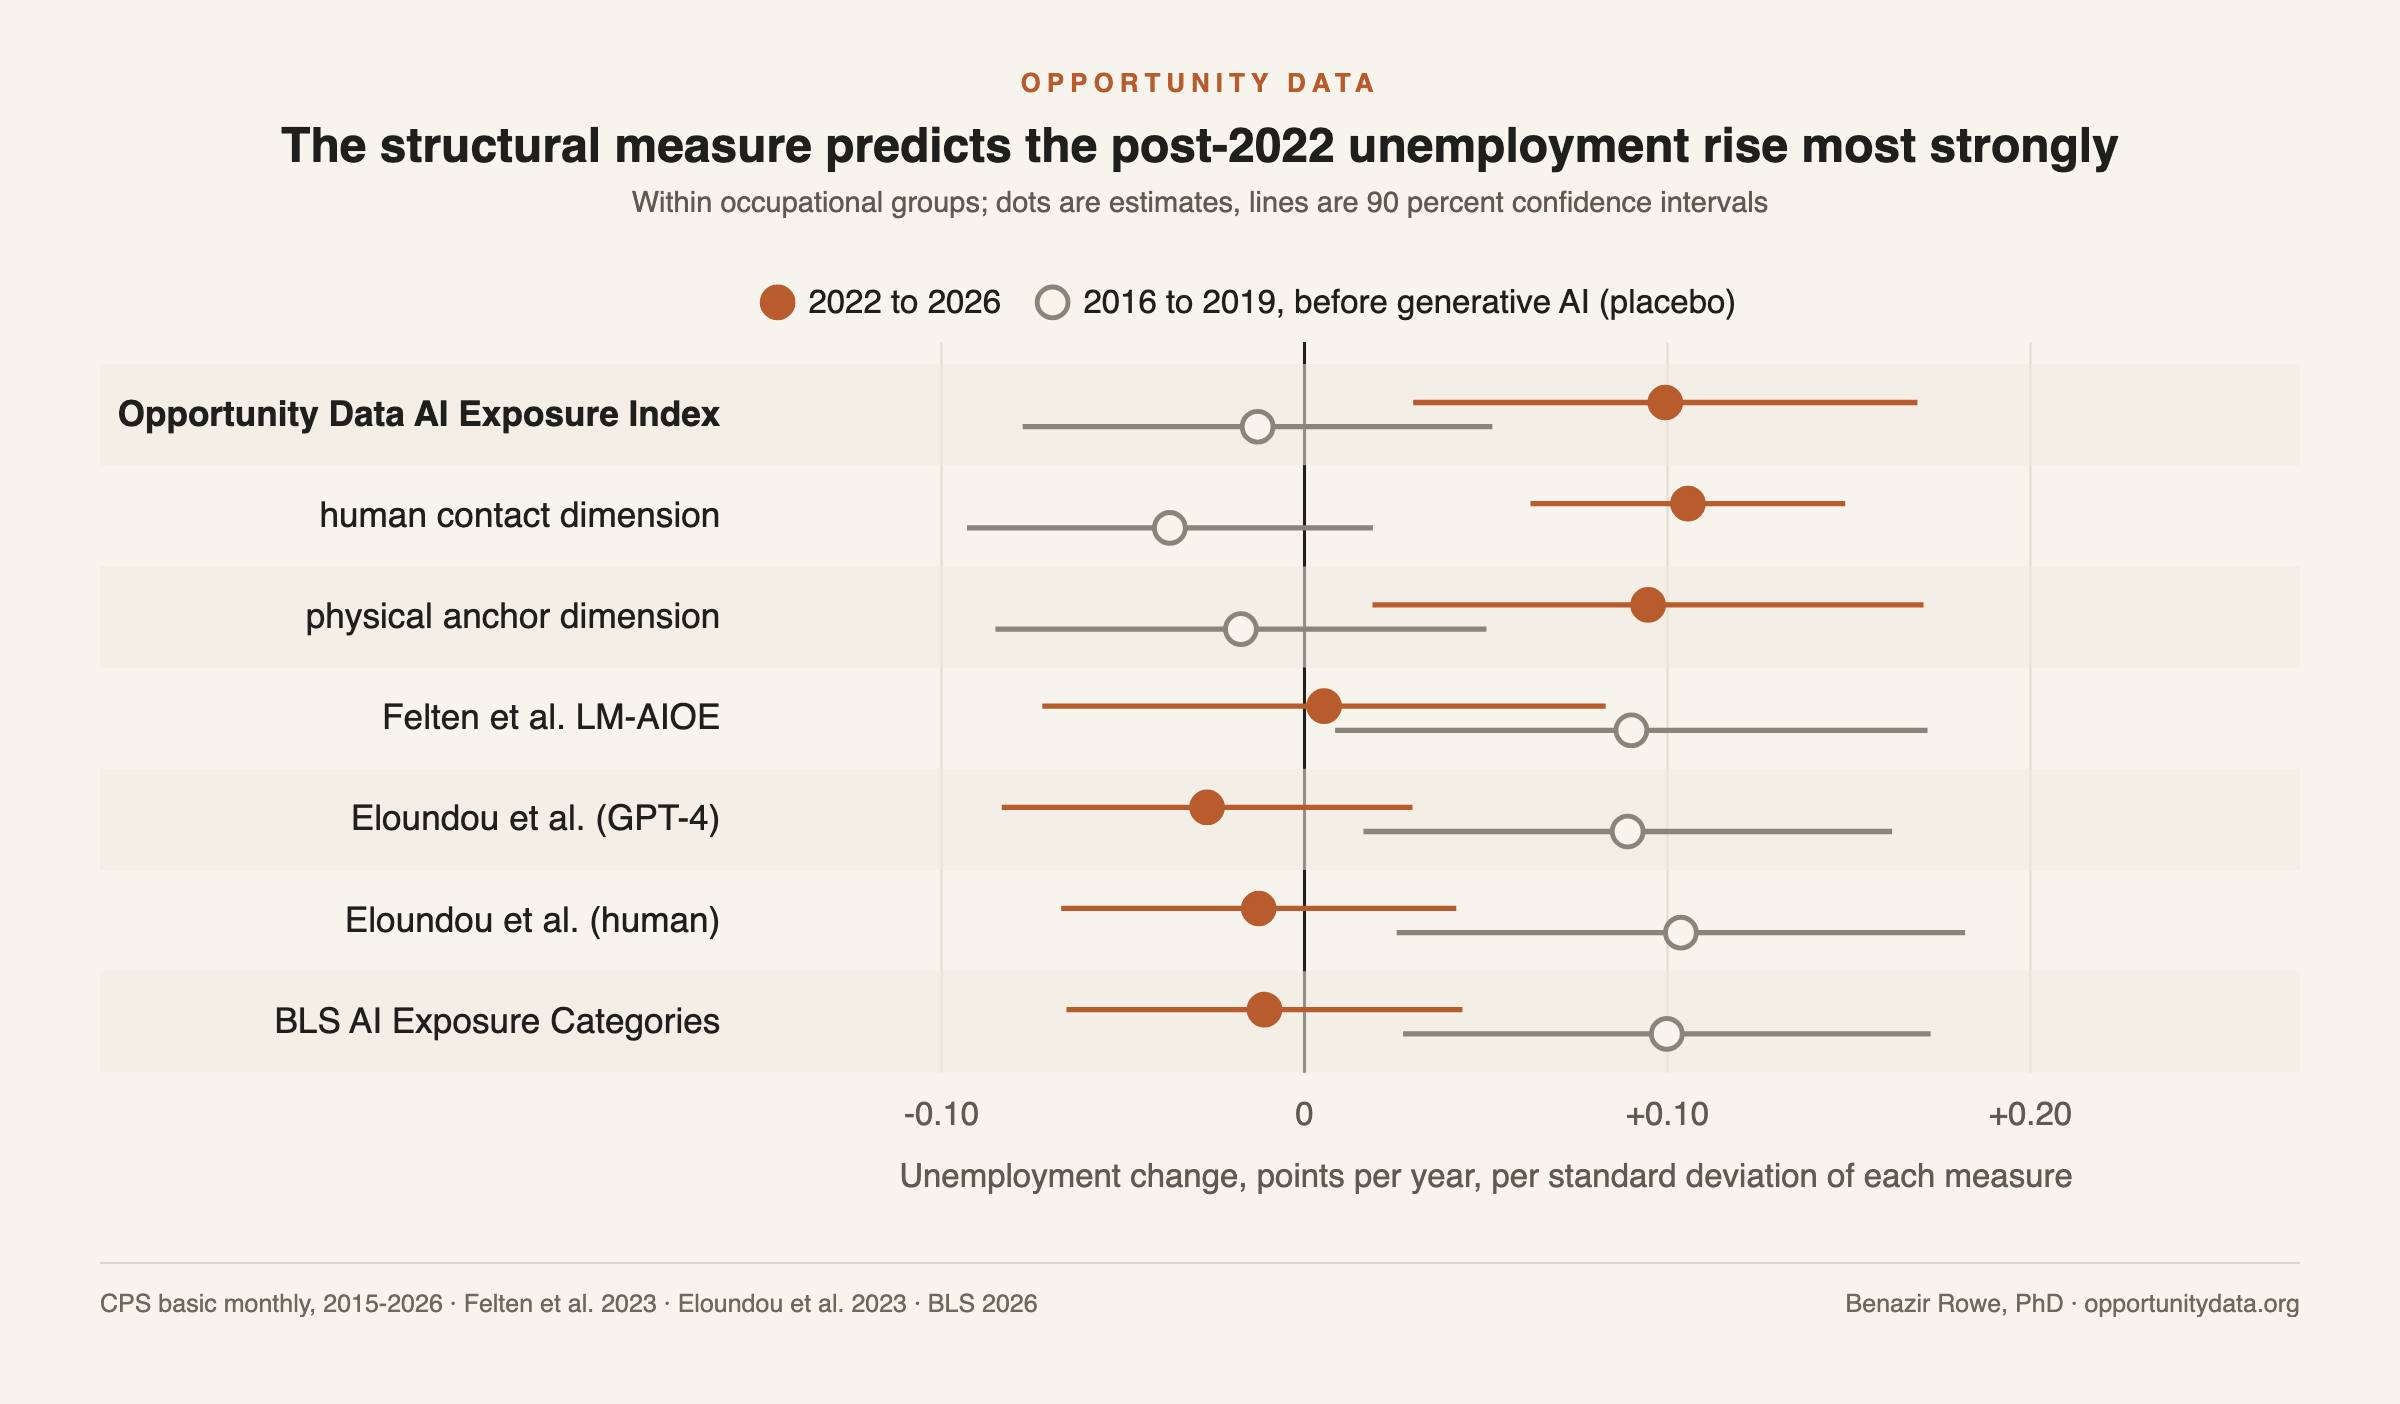
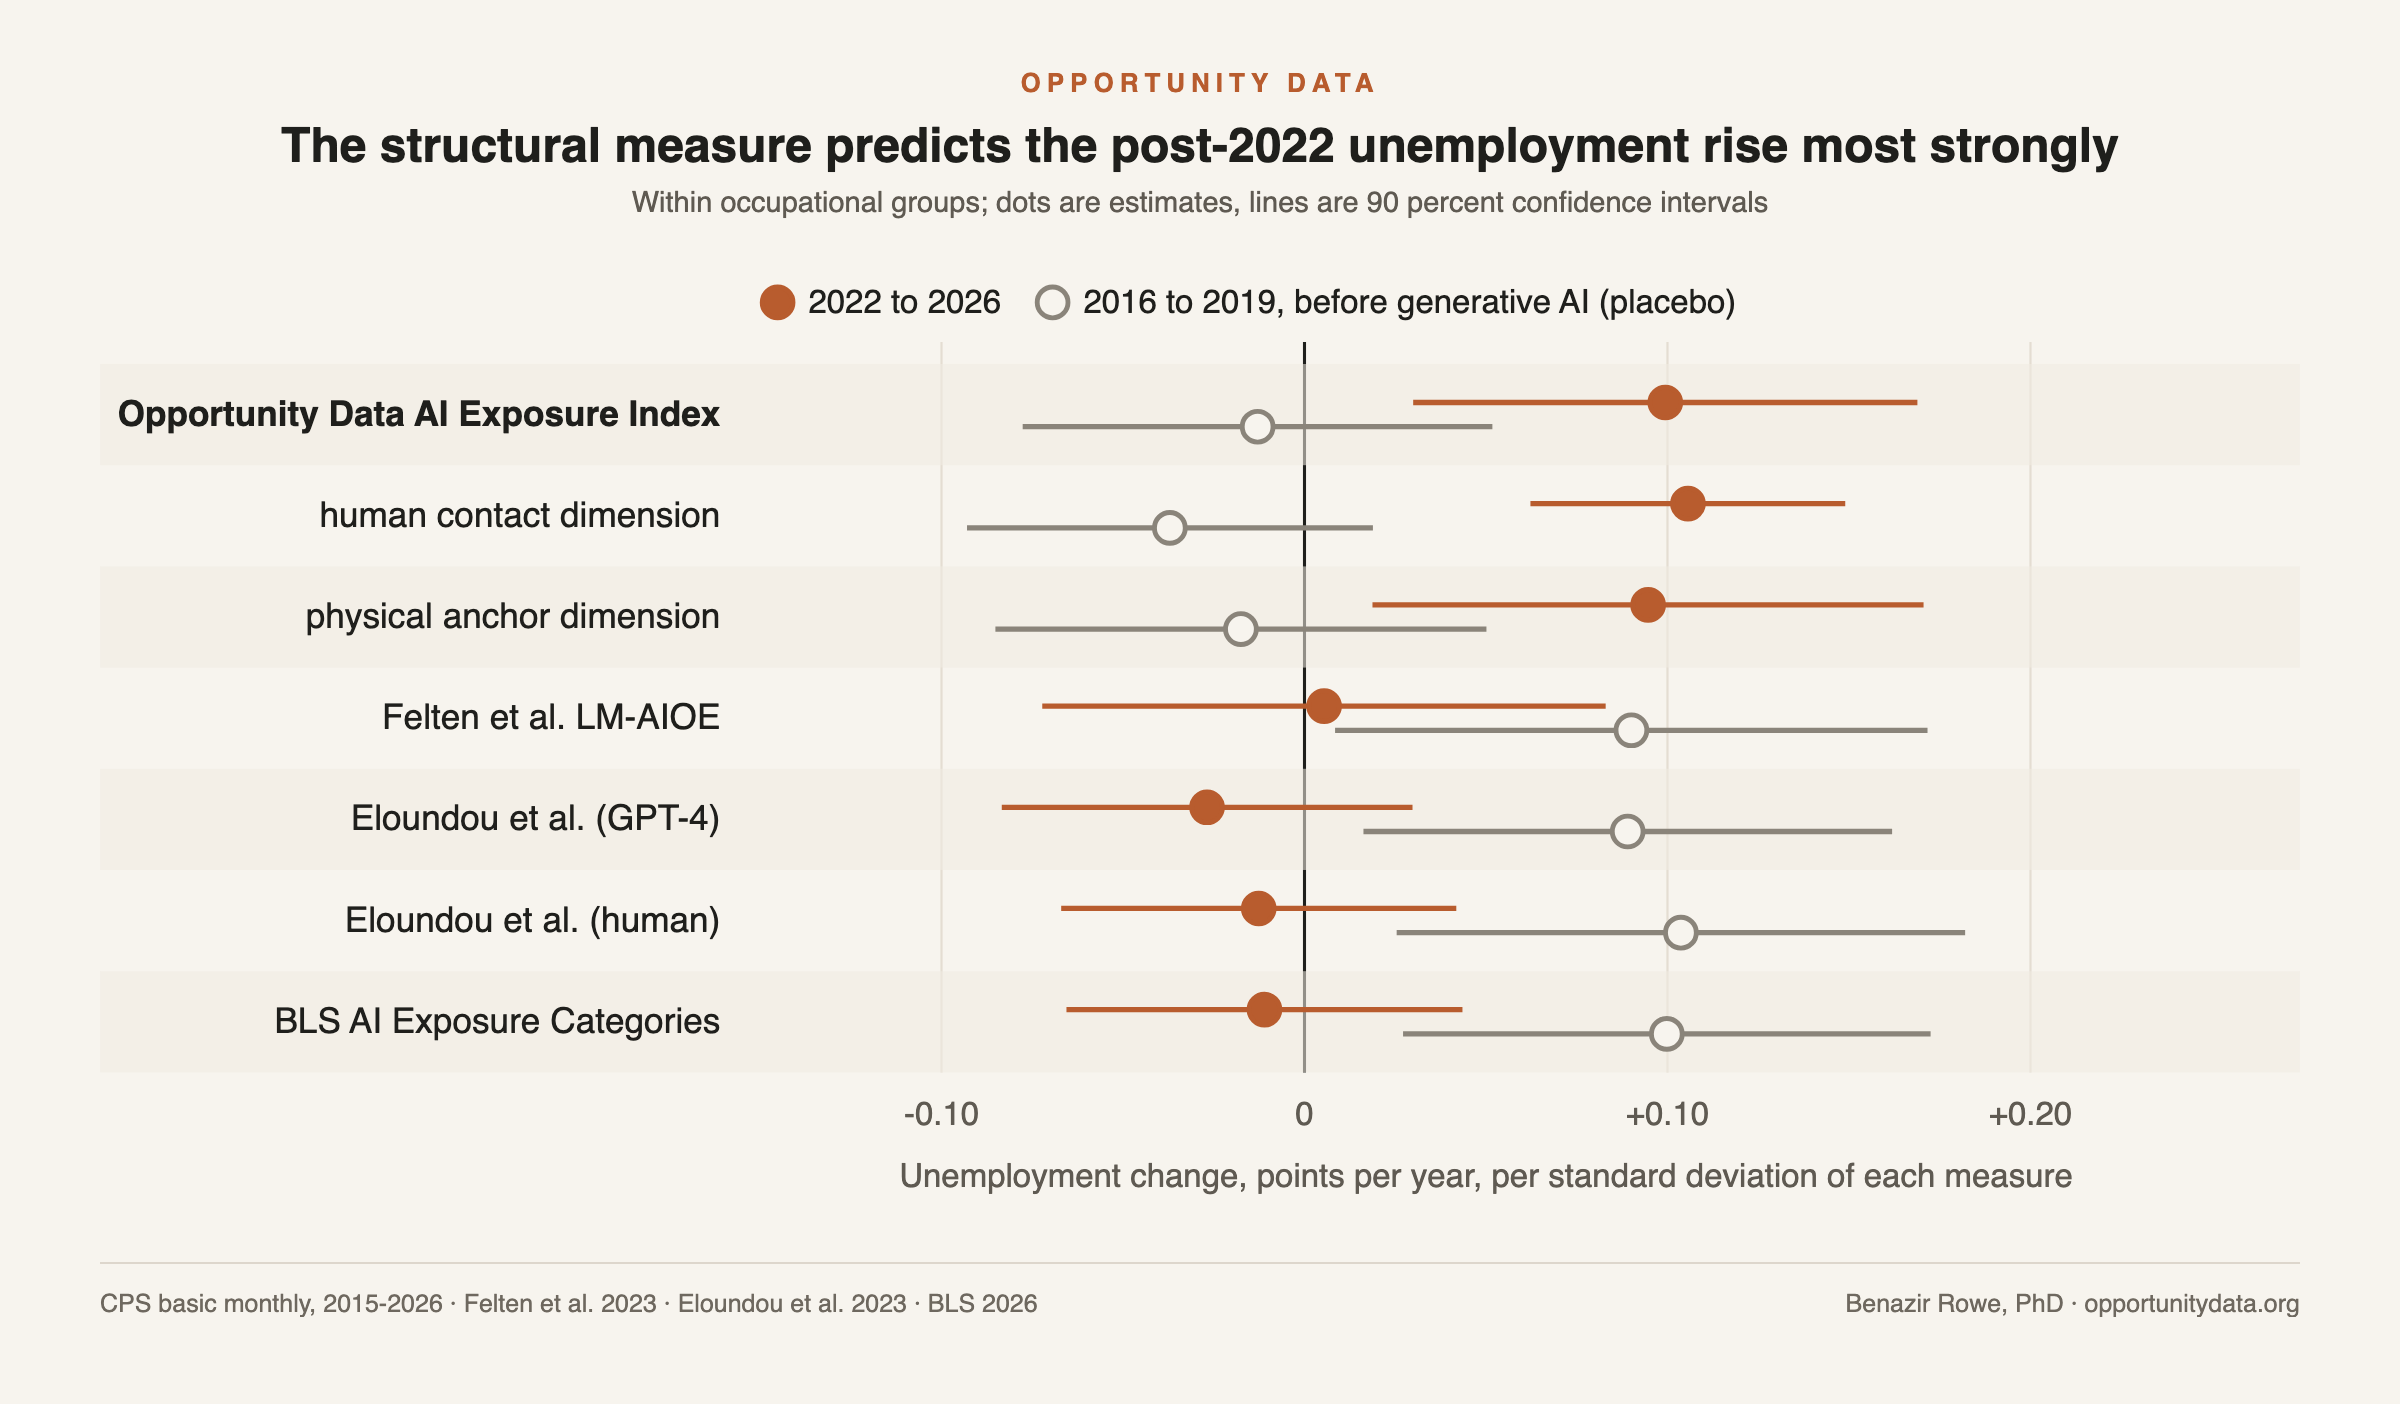
We tested the Opportunity Data AI Exposure Index, Felten, Raj and Seamans's LM-AIOE, the Eloundou et al. GPT-4 and human ratings, and the BLS AI Exposure Categories against what happened to 738 occupations after November 2022. Within occupational groups, unemployment rose +0.10 points a year faster per standard deviation of the Opportunity Data AI Exposure Index (p=0.019; +4.3% per year as a proportional change), the strongest relationship of the five. Felten et al. also predicts the rise as a proportional change (+3.4%, p=0.032); the other three measures do not reach significance.
Jobs with little human contact are also the jobs that can be done remotely. Holding remote-work potential constant, the Opportunity Data AI Exposure Index still predicts the rise (+0.11 points a year, p=0.021) and none of the four other measures does, on either scale. No measure, including ours, predicts employment or wage change once sector composition is controlled for.
What we tested
Each measure scores occupations by exposure to AI. The test is whether those scores predict what happened next: unemployment by occupation of last job and the gap between young and prime-age workers in the Current Population Survey through September 2026, and employment and median wages in the Occupational Employment and Wage Statistics through May 2025. Every measure was standardized and run through identical regressions. Each result is repeated for 2016 to 2019, before any generative AI: a measure that predicts that window as well is tracking an older trend, not AI. The main comparisons are made within occupational groups (office work against office work, health care against health care), so a sector-wide boom or bust cannot produce them.
Capability ratings record the AI of their collection window. The measures tested were built at different points on the capability curve:
| Measure | What it rates AI as | Published | Built from |
|---|---|---|---|
| Felten, Raj and Seamans LM-AIOE | AI application benchmarks of the 2010s, reweighted for language modeling | 2023 | Abilities x AI applications |
| Eloundou, Manning, Mishkin and Rock | GPT-4 and human raters, March 2023 | 2023 (Science 2024) | Task-level capability ratings |
| BLS AI Exposure Categories | Three studies from 2020-23 plus Claude and Copilot usage through January 2025 | August 2026 | Synthesis of capability and usage |
| Opportunity Data AI Exposure Index | Assumes frontier capability as of April 2026; scores what still binds | September 2026 | O*NET work structure, three dimensions |
Unemployment: the strongest predictor of the rise
Experienced-worker unemployment rose from 3.4 to 3.8 percent between mid-2022 and mid-2026. Within occupational groups, a one standard deviation higher Opportunity Data AI Exposure Index score predicts unemployment rising +0.10 points a year faster (p=0.019), about 0.4 points over the period, with no relationship before generative AI (-0.01, p=0.742). The human contact dimension accounts for most of the result (+0.11, p<0.001).
Measured in percentage points, the four competing measures show no post-2022 relationship (-0.03 to +0.01) and a positive one in 2016 to 2019 (+0.09 to +0.10). That 2016-19 pattern disappears when the outcome is the proportional change (-1.3% to +1.1%), so it reflects the lower starting unemployment of occupations those measures rate exposed, not a pre-AI trend. As a proportional change, the Opportunity Data AI Exposure Index predicts the rise at +4.3% per year (p=0.006) and Felten et al. at +3.4% (p=0.032); the Eloundou et al. and BLS measures do not reach significance.
Download for republication: PNG · SVG. Free to republish with credit to Opportunity Data.

Remote work, scale and chance
Occupations with little face-to-face contact are also the occupations that can be done from home, and remote work, return-to-office policies and technology-sector retrenchment all moved after 2022. Holding remote-work potential constant (Dingel and Neiman 2020), the Opportunity Data AI Exposure Index still predicts the rise: +0.11 points a year (p=0.021) and +3.9% as a proportional change (p=0.023). None of the four other measures does on either scale (proportional +0.4% to +1.9%, all p>0.18). Remote-work potential on its own predicts the proportional rise (+2.8%, p=0.038) but not the change in points (+0.06).
Shuffling the Opportunity Data AI Exposure Index scores within occupational groups 1,000 times produces a result as strong as the observed one with probability 0.005 on the points scale and less than 0.001 on the proportional scale. One control weakens the composite: adding each occupation's late-2022 unemployment rate cuts it to +0.06 (p=0.174), while the human contact dimension holds at +0.11 (p=0.002). Because that base rate is measured with error and enters the outcome, the control is prone to regression to the mean; controlling for the 2019 rate instead strengthens the result (+0.13).
Inside digital work, capability ratings no longer sort occupations
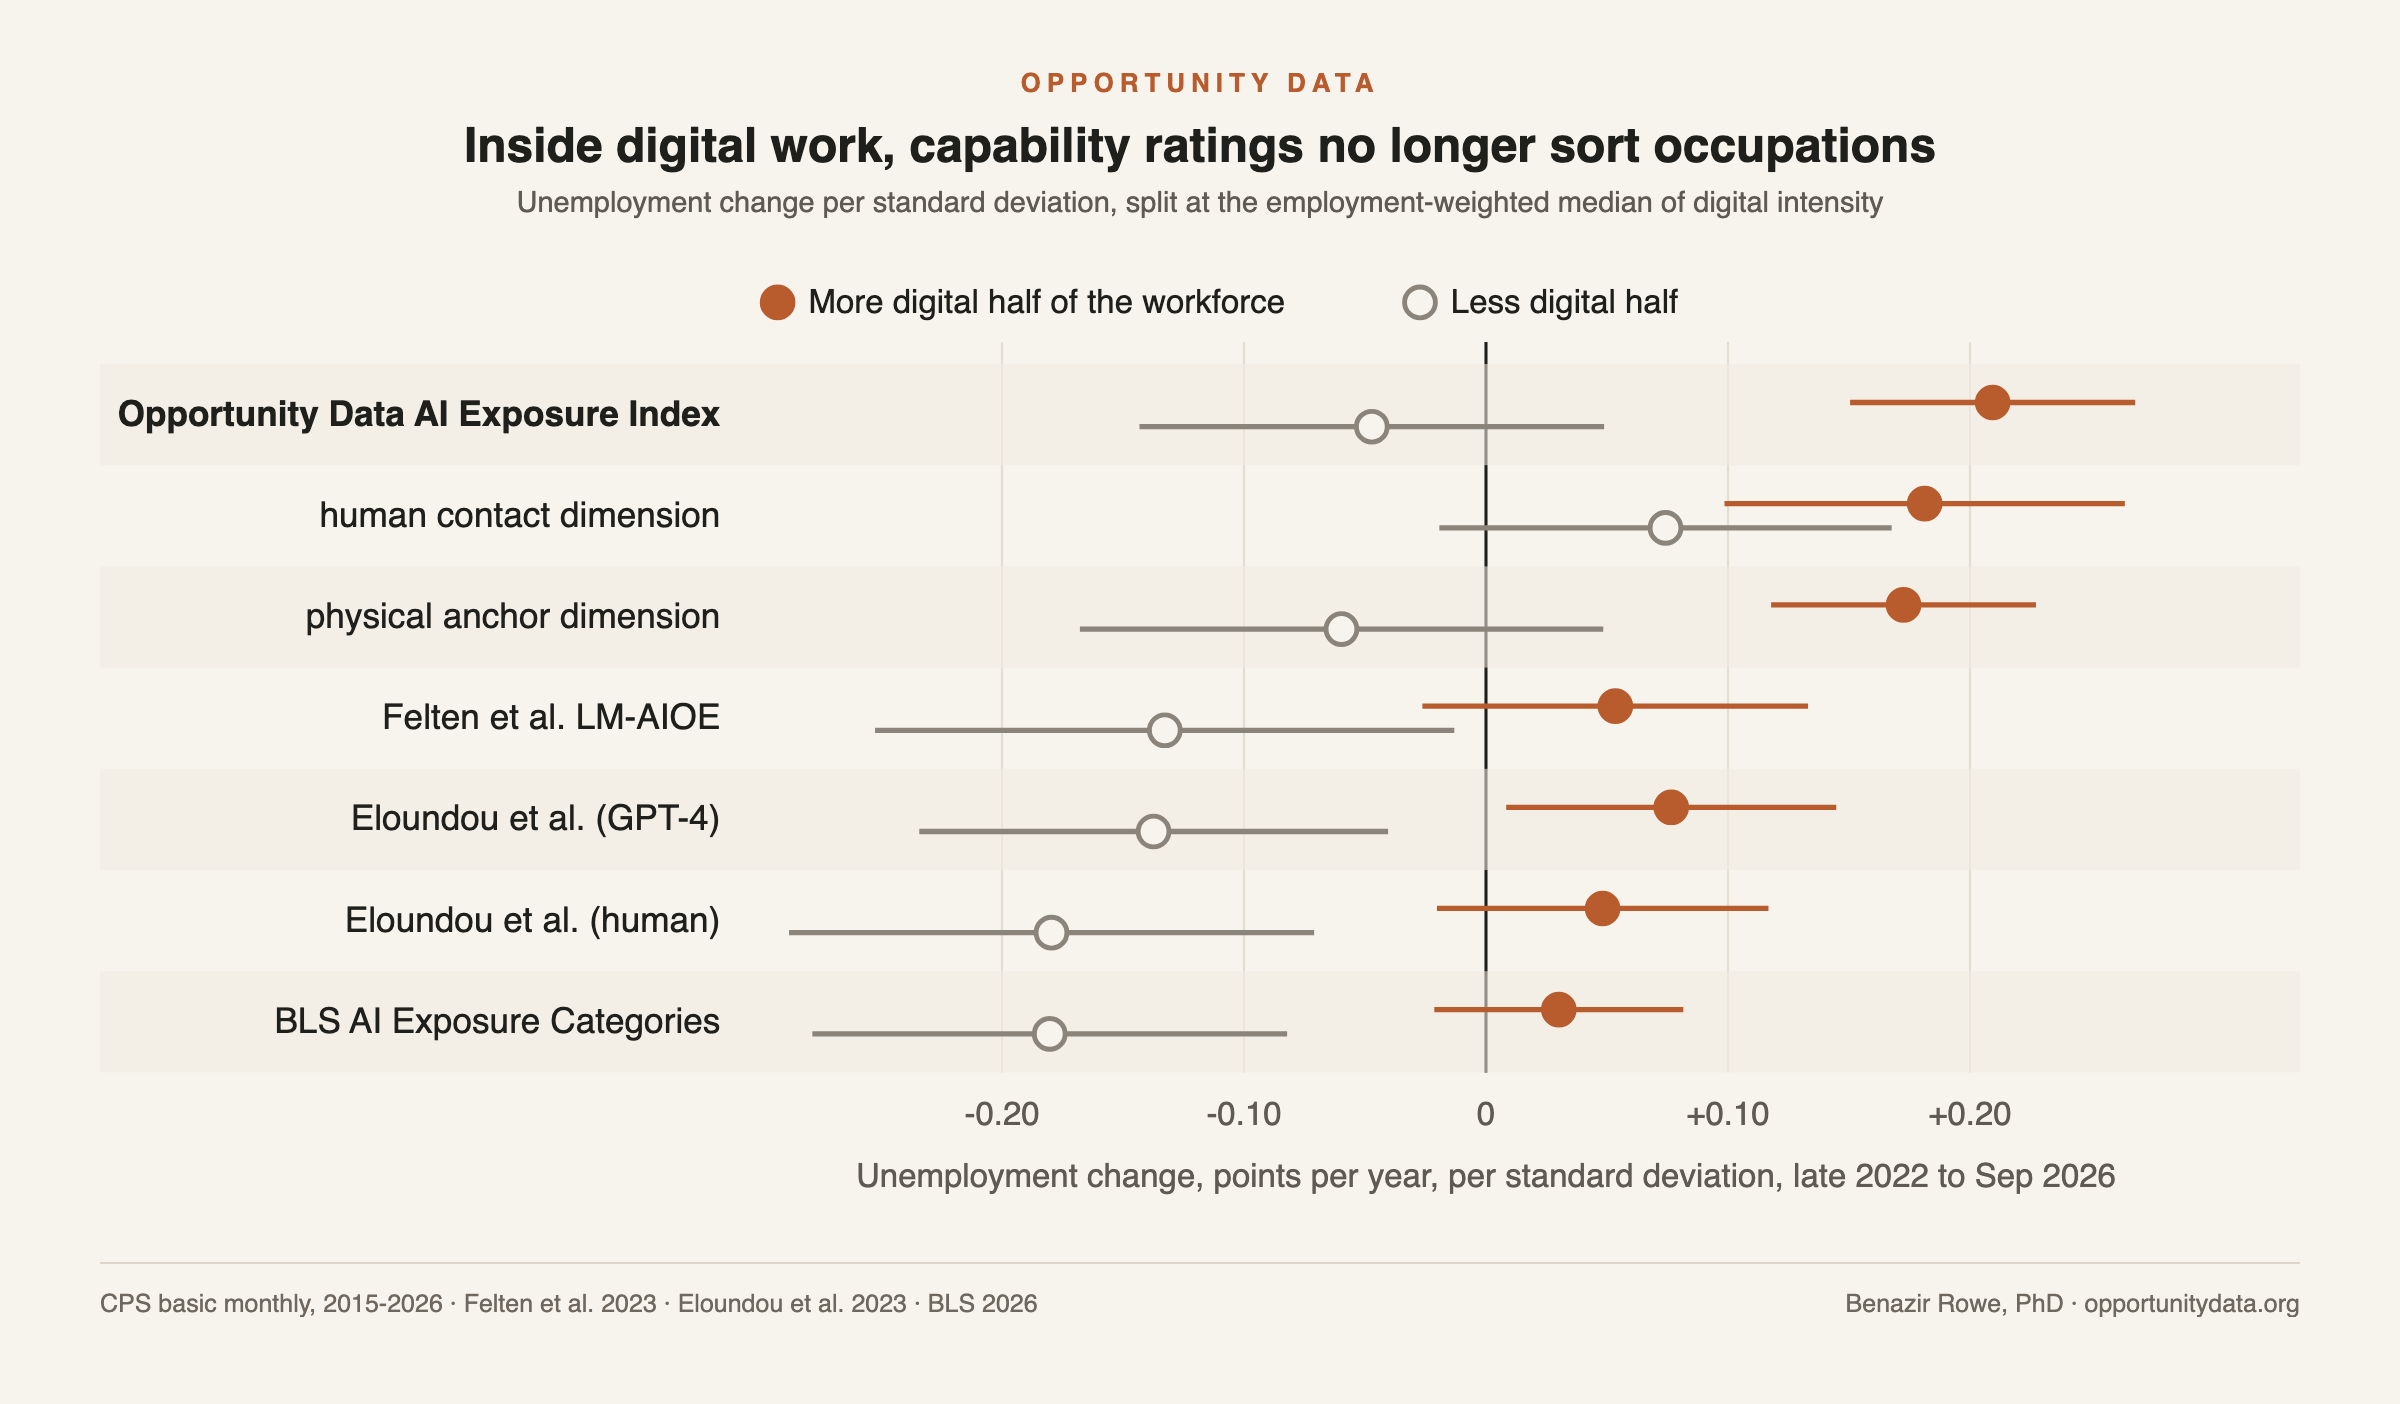
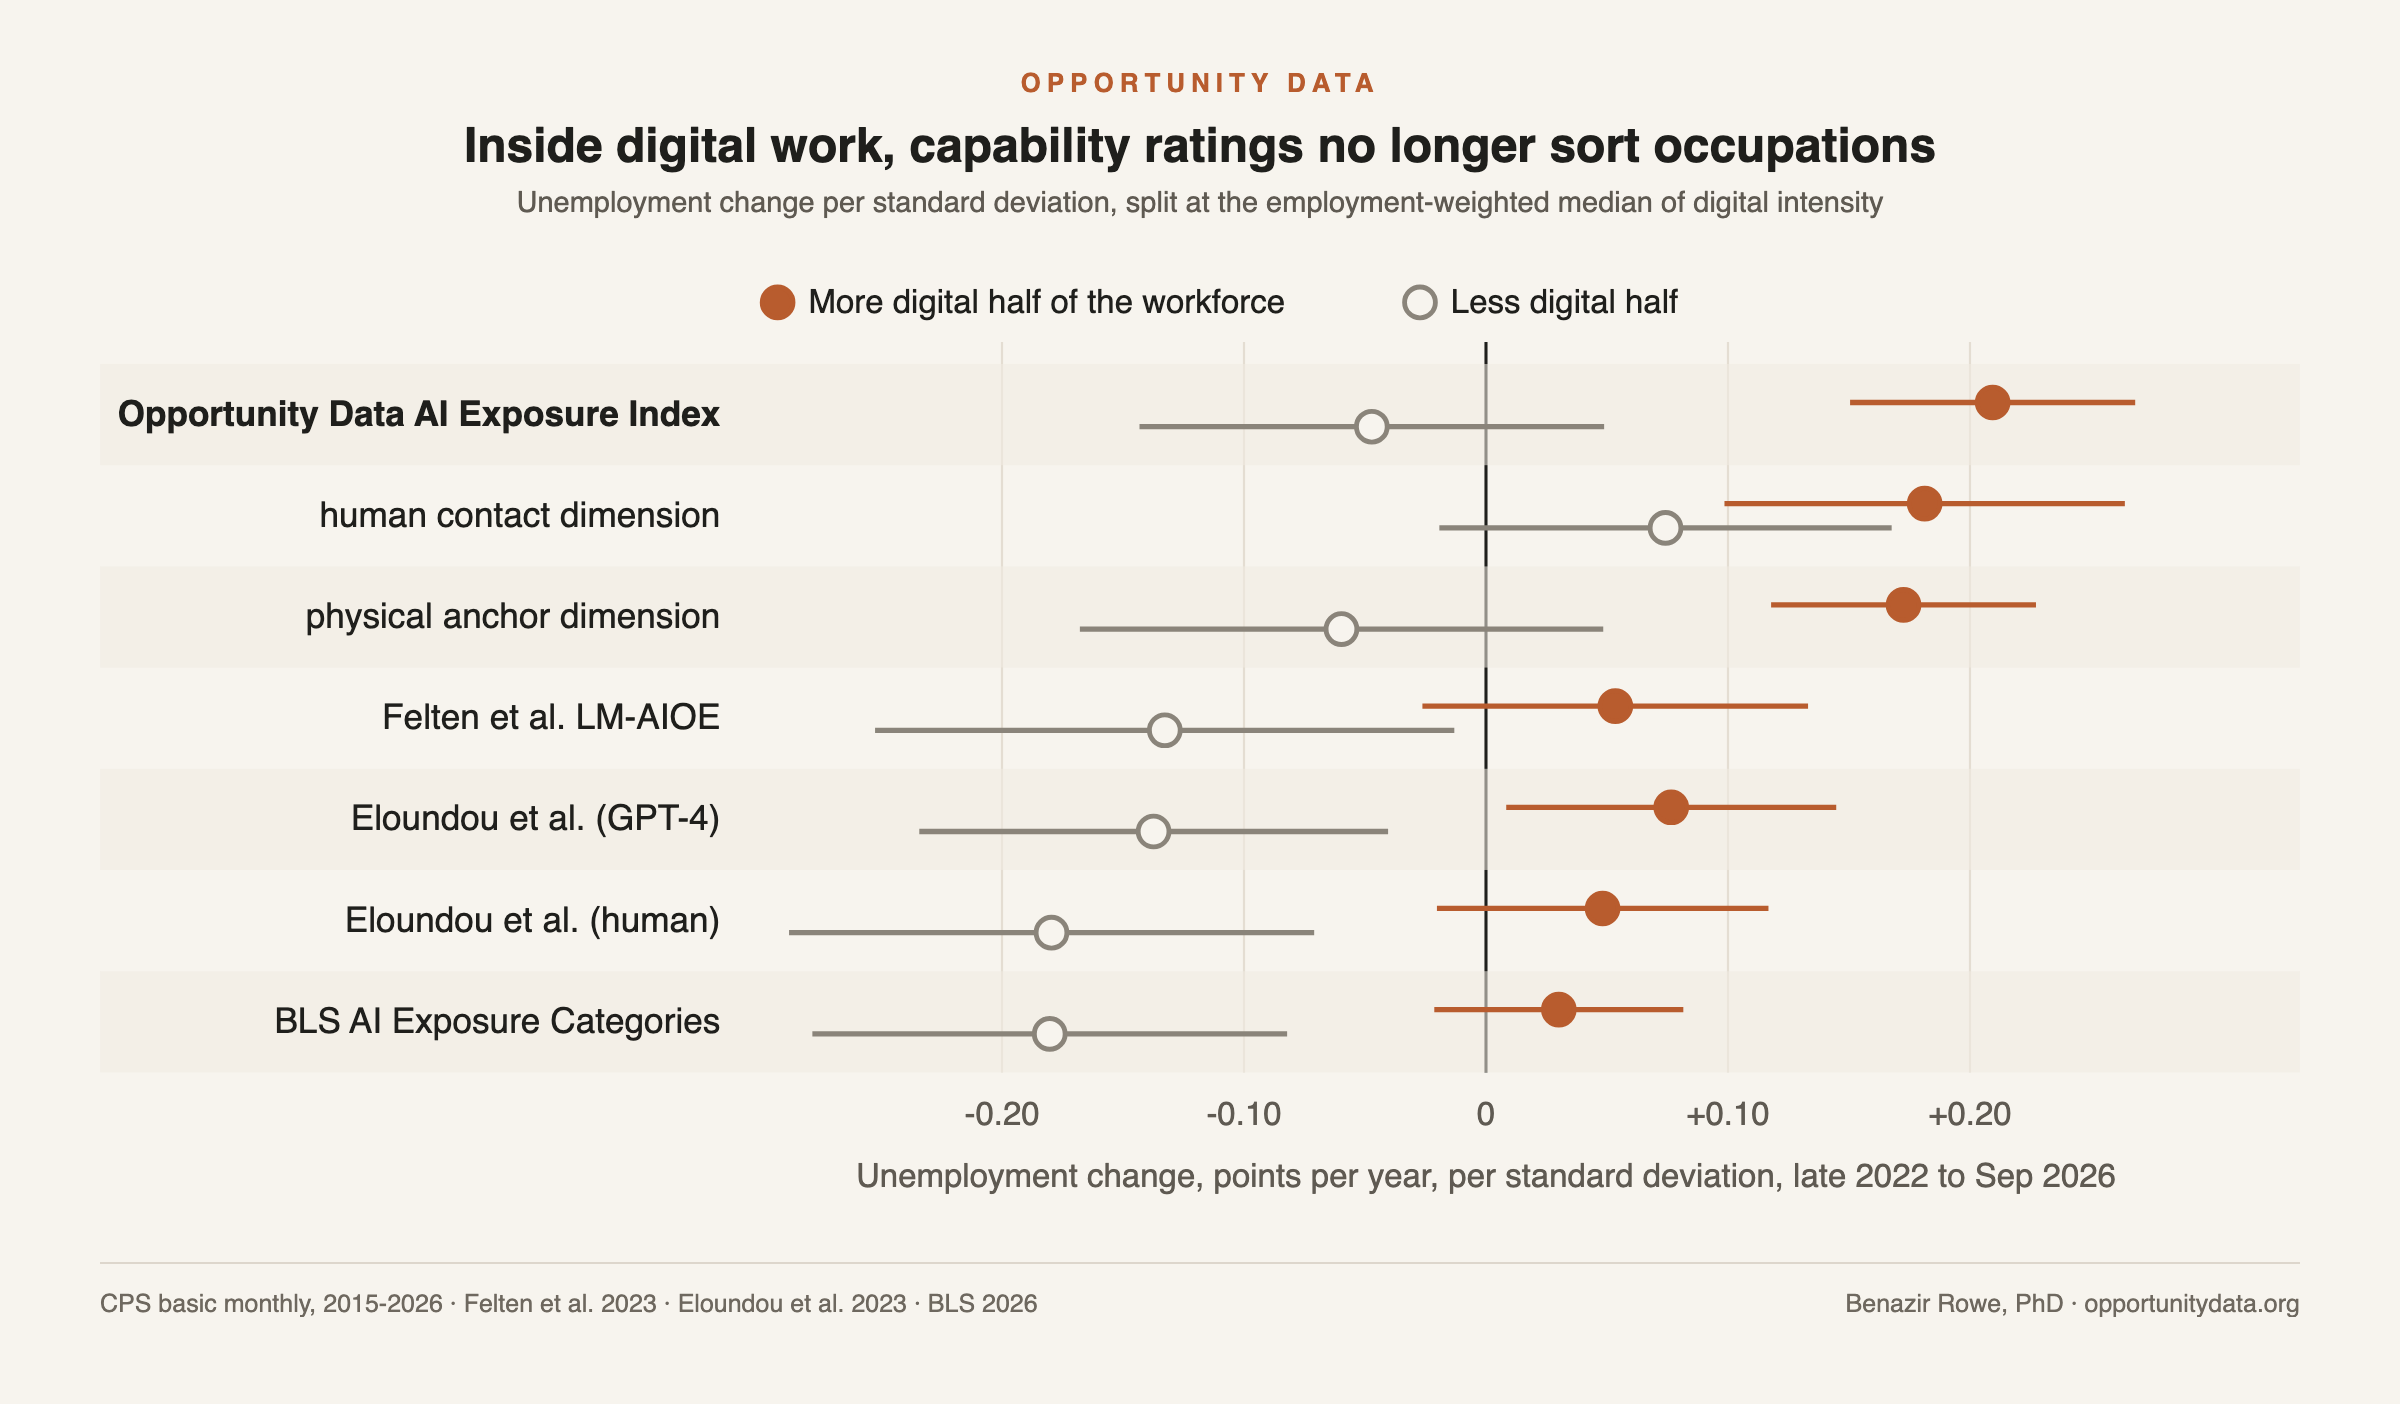
If frontier models can already do most digitally mediated tasks, ratings of what AI can do should stop separating digital occupations from one another. Splitting the workforce at the employment-weighted median of digital intensity tests that directly (measured in percentage points). In the more digital half (186 occupation groups) the four capability and usage measures keep 77 to 84 percent of the spread they have across all occupations, so they still rank these occupations differently, but none of those rankings predicts the unemployment change at the 5 percent level: +0.03 to +0.08 (p 0.06 to 0.34). The Opportunity Data AI Exposure Index predicts the unemployment rise there at +0.21 (p<0.001), through human contact (+0.18) and the physical anchor (+0.17).
In the less digital half the capability measures predict in the wrong direction: occupations they rate more exposed saw unemployment fall relative to their groups (-0.18 to -0.13, p 0.002 to 0.07). The Opportunity Data AI Exposure Index is near zero there (-0.05, p=0.419).
Download for republication: PNG · SVG. Free to republish with credit to Opportunity Data.

Where BLS and the Opportunity Data AI Exposure Index disagree
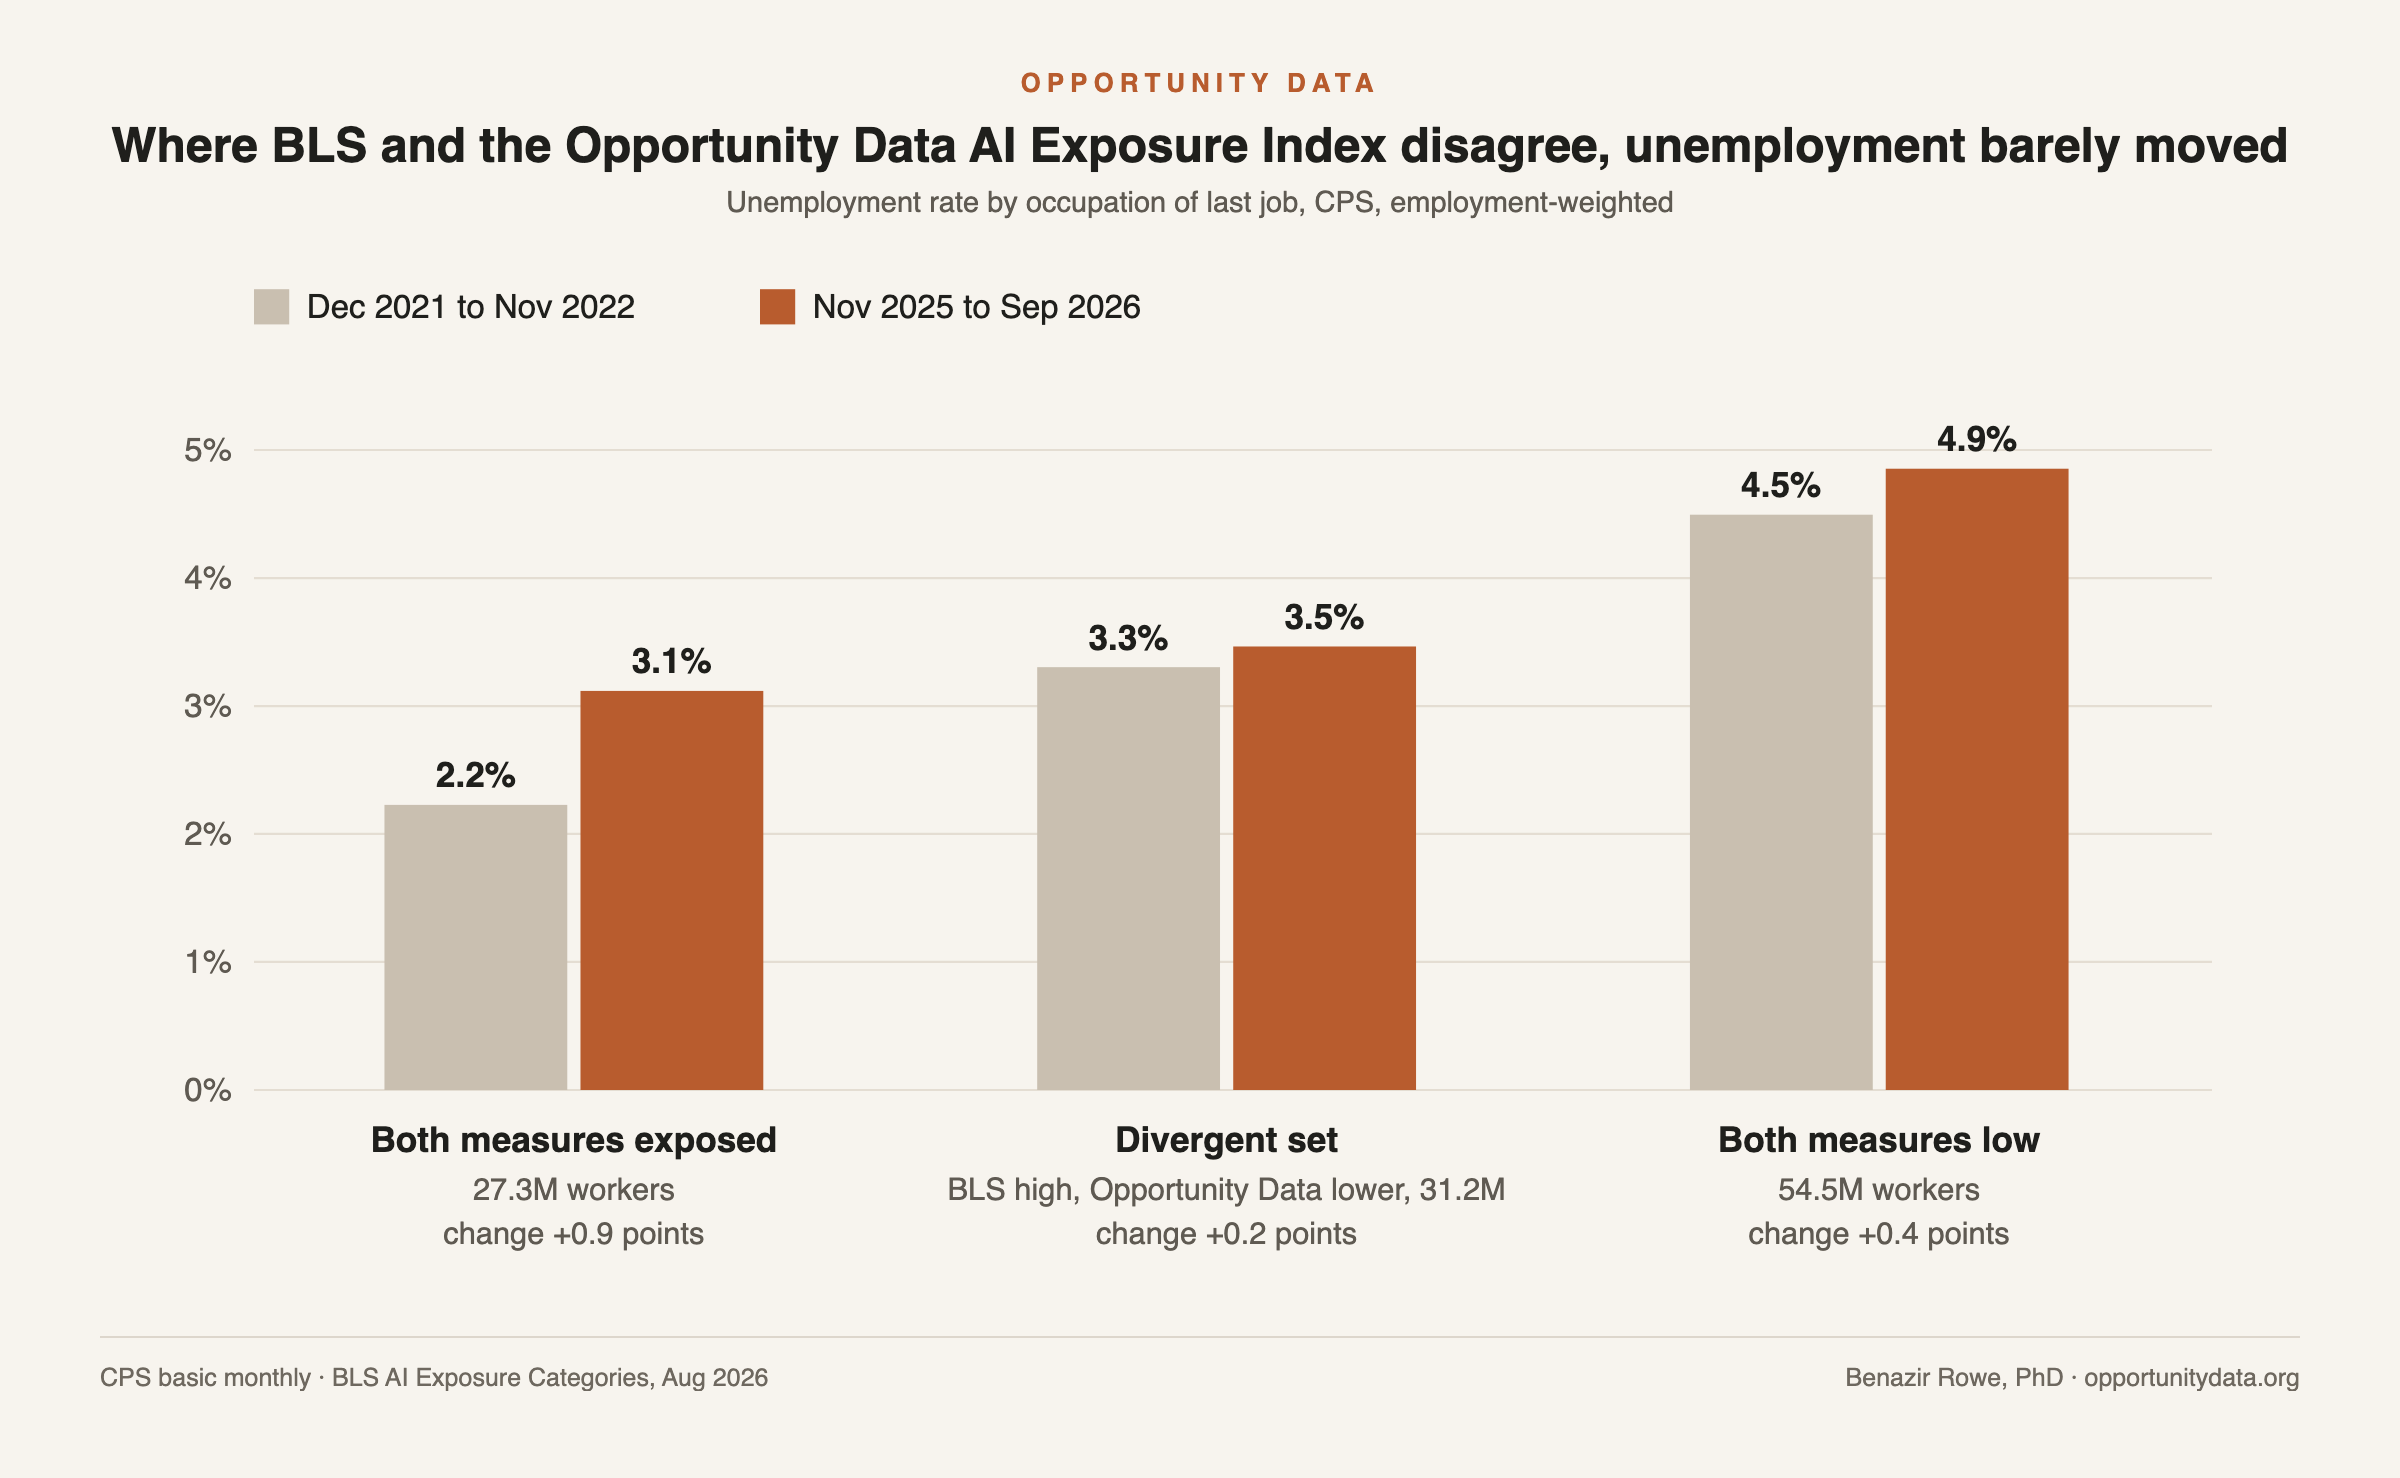
The BLS comparison identified occupations that BLS rates High or Very high and the Opportunity Data AI Exposure Index rates two or more tiers lower: teaching, nursing, counseling, front-line sales and service, office support. Usage-based inputs rate these occupations highly exposed because their workers use AI heavily. Their unemployment rose 0.2 points, from 3.3 to 3.5 percent, against 0.9 points for occupations both measures rate exposed and 0.4 for occupations both rate low. Employment in the divergent set grew 2.7 percent from May 2022 to May 2025, faster than its 1.2 percent in 2016-19; in the jointly exposed set growth slowed from 5.1 to 2.6 percent.
Download for republication: PNG · SVG. Free to republish with credit to Opportunity Data.

Where no measure succeeds
Young workers. Across occupations, a one standard deviation higher score on any of the five measures predicts employment of 22 to 27 year-olds growing 1.63 to 1.79 points a year slower than employment of 35 to 54 year-olds in the same occupation, with no such pattern in 2016-19 (-0.20 to +0.96). The shift is real and every measure detects it equally. It runs between broad groups, computer, business and office work against the rest, and no measure separates occupations within a group (all p>0.33).
Employment. Within groups the Opportunity Data AI Exposure Index predicts slower OEWS employment growth (-0.56, p=0.067) until the share of an occupation in information, finance and professional services is controlled for (-0.20, p=0.533): most of that signal was the 2022-24 rate cycle and tech retrenchment. The competing measures are at -0.07 to +0.81. The human contact dimension survives the sector control (-0.59, p=0.041) but not an unweighted regression.
Wages. Exposed occupations had faster median wage growth on every measure once trends are controlled for (+0.24 to +0.52 points a year), the Opportunity Data AI Exposure Index the smallest at +0.24.
Year by year. In rolling 12-month windows every measure predicted the 2024 rise in unemployment, the capability measures most strongly. Since September 2025, 1 of 40 year-over-year estimates across the eight measures are significant; the latest window shows the Opportunity Data AI Exposure Index at +0.14 and the four competitors at -0.10 to -0.02, none significant. The data cannot yet say whether the capability measures are fading.
| Measure | Unemployment, 2022-26 | Placebo, 2016-19 | Inside digital work | Ages 22-27 vs 35-54 | Employment, OEWS 2022-25 |
|---|---|---|---|---|---|
| Opportunity Data AI Exposure Index | +0.10 (p=0.019) | -0.01 (p=0.742) | +0.21 (p<0.001) | -1.64 (p<0.001) | -0.20 (p=0.533) |
| Felten, Raj and Seamans LM-AIOE | +0.01 (p=0.909) | +0.09 (p=0.070) | +0.05 (p=0.270) | -1.79 (p<0.001) | +0.81 (p=0.099) |
| Eloundou et al., GPT-4 ratings | -0.03 (p=0.435) | +0.09 (p=0.044) | +0.08 (p=0.065) | -1.75 (p<0.001) | -0.07 (p=0.830) |
| Eloundou et al., human ratings | -0.01 (p=0.703) | +0.10 (p=0.029) | +0.05 (p=0.247) | -1.76 (p<0.001) | +0.29 (p=0.502) |
| BLS AI Exposure Categories | -0.01 (p=0.740) | +0.10 (p=0.024) | +0.03 (p=0.336) | -1.63 (p<0.001) | +0.43 (p=0.192) |
Our assessment
The forward test
The outcome windows above end in September 2026, months after the April 2026 frontier the Opportunity Data AI Exposure Index was designed against. The test that matters for that design is forward. Scores are frozen at the September 2026 release, and six hypotheses are fixed in advance, to be scored on the CPS through September 2027 and September 2028 and on OEWS May 2026 and May 2027. Every result will be published here whatever it shows, with the same statistics for each competing measure. The registration was RFC 3161 timestamped on November 6, 2026 (freetsa.org, serial 0x09D16E2E) and is in the replication package with the certificates to verify it.
- H1. Unemployment by occupation of last job rises faster in occupations with higher Opportunity Data AI Exposure Index scores, within occupational groups.
- H2. The H1 result holds with each competing measure in the same regression.
- H3. Unemployment in the divergent set rises less than in the jointly exposed set.
- H4. OEWS employment growth from May 2025 is slower in higher-scoring occupations, with sector controls.
- H5. Inside the more digital half of the workforce, the H1 result holds for the Opportunity Data AI Exposure Index and the four capability and usage measures add no predictive power.
- H6 (exploratory). Within occupational groups, employment of 22 to 27 year-olds falls relative to 35 to 54 year-olds in higher-scoring occupations.
What this means for
Taxpayer perspective
Why this matters to taxpayers
Federal and state workforce dollars, including Workforce Pell grants from July 2026, are steered by judgments about which occupations have a future. When an exposure measure misranks occupations, money moves away from programs whose graduates are keeping jobs and toward programs that only look safe on a 2023 rating. A measure that has been tested against unemployment records is a cheaper and more accountable basis for those judgments than one that has not.
What you can do
- Ask your state workforce board which AI exposure measure, if any, informs its eligible-training lists, and whether it has been tested against outcomes.
- Ask that any exposure measure used for funding decisions publish a forward test with fixed dates.
- Use the occupation-level files below to check the programs your state funds.
Sensitivity checks
| Check | Variant | Result |
|---|---|---|
| Remote-work potential | Adds Dingel and Neiman (2020) teleworkability | Unemployment: Opportunity Data AI Exposure Index holds (+0.11 points, p=0.021; +3.9% proportional, p=0.023); no other measure significant on either scale |
| Proportional outcome | Log change in each occupation's unemployment rate | Opportunity Data AI Exposure Index +4.3% (p=0.006); Felten et al. +3.4% (p=0.032); others +1.3% to +2.2% (p 0.10 to 0.26) |
| Starting unemployment level | Adds the 2019 or the late-2022 unemployment rate | 2019 level: Opportunity Data AI Exposure Index strengthens to +0.13 (p=0.003). Late-2022 level: composite falls to +0.06 (p=0.174), human contact dimension holds at +0.11 (p=0.002) |
| Shuffle test | Scores permuted within occupational groups, 1,000 draws | Opportunity Data AI Exposure Index p=0.005 (points), p<0.001 (proportional); Felten et al. p=0.011 (proportional); others p 0.39 to 0.86 (points) |
| Common sample | Only occupation groups scored by all five measures (353) | Opportunity Data AI Exposure Index +0.11 points; competitors unchanged |
| COVID dip and recovery control | Adds 2019-22 employment change | Unemployment: +0.11 (p=0.014); competitors unchanged near zero |
| Head to head | The Opportunity Data AI Exposure Index and one competitor in the same regression | Opportunity Data AI Exposure Index stays +0.14 to +0.18 (all p<0.01); competitors -0.13 to -0.09 |
| Sector composition | Adds share of employment in Information, Finance, Professional Services, Management | Employment: Opportunity Data AI Exposure Index falls from -0.56 to -0.20 (p=0.533) |
| Sample floor, young workers | 30, 50 and 80 respondents aged 22-27 per window | Cross-sector shift holds for all five measures; within-group estimates not significant at any floor |
| Drop computer and math occupations | SOC major group 15 removed | Employment results unchanged in sign for every measure |
| Unweighted | Each occupation group counts equally | Employment: human contact result does not hold |
| Year by year | Rolling 12-month windows, December 2022 to September 2026 | All measures predicted the 2024 rise (competitors up to +0.47); 1 of 40 estimates since September 2025 significant |
About this analysis
Opportunity Data is an independent research platform. The author built the Opportunity Data AI Exposure Index, which is one of the five measures tested; to limit that conflict, every measure is run through identical code, every outcome and specification is published including those where the Opportunity Data AI Exposure Index does not outperform, and the forward test is fixed in advance.